Analyzing PostgreSQL logs using CloudWatch Logs Insights
With the PostgreSQL logs from your Aurora PostgreSQL DB cluster published as CloudWatch Logs, you can use CloudWatch Logs Insights to interactively search and analyze your log data in Amazon CloudWatch Logs. CloudWatch Logs Insights includes a query language, sample queries, and other tools for analyzing your log data so that you can identify potential issues and verify fixes. To learn more, see Analyzing log data with CloudWatch Logs Insights in the Amazon CloudWatch Logs User Guide.
To analyze PostgreSQL logs with CloudWatch Logs Insights
Open the CloudWatch console at https://console.aws.amazon.com/cloudwatch/
. -
In the navigation pane, open Logs and choose Log insights.
-
In Select log group(s), select the log group for your Aurora PostgreSQL DB cluster.

-
In the query editor, delete the query that is currently shown, enter the following, and then choose Run query.
##Autovacuum execution time in seconds per 5 minute
fields @message
| parse @message "elapsed: * s" as @duration_sec
| filter @message like / automatic vacuum /
| display @duration_sec
| sort @timestamp
| stats avg(@duration_sec) as avg_duration_sec,
max(@duration_sec) as max_duration_sec
by bin(5 min)
-
Choose the Visualization tab.

-
Choose Add to dashboard.
-
In Select a dashboard, either select a dashboard or enter a name to create a new dashboard.
-
In Widget type, choose a widget type for your visualization.

-
(Optional) Add more widgets based on your log query results.
-
Choose Add widget.
-
Choose a widget type, such as Line.

-
In the Add to this dashboard window, choose Logs.

-
In Select log group(s), select the log group for your DB cluster.
-
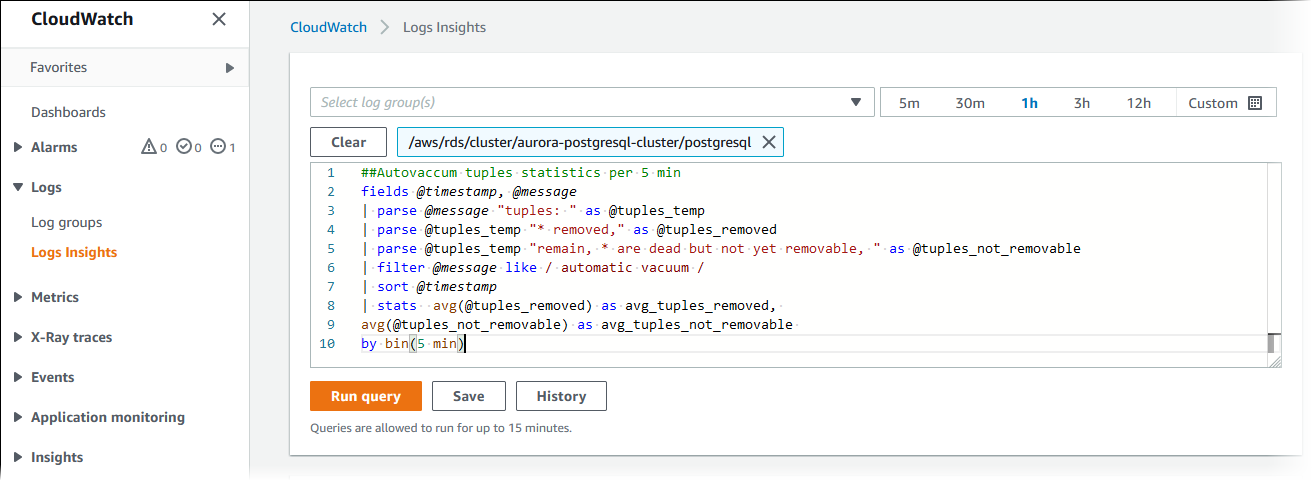
In the query editor, delete the query that is currently shown, enter the following, and then choose Run query.
##Autovacuum tuples statistics per 5 min
fields @timestamp, @message
| parse @message "tuples: " as @tuples_temp
| parse @tuples_temp "* removed," as @tuples_removed
| parse @tuples_temp "remain, * are dead but not yet removable, " as @tuples_not_removable
| filter @message like / automatic vacuum /
| sort @timestamp
| stats  avg(@tuples_removed) as avg_tuples_removed,
avg(@tuples_not_removable) as avg_tuples_not_removable
by bin(5 min)
-
Choose Create widget.
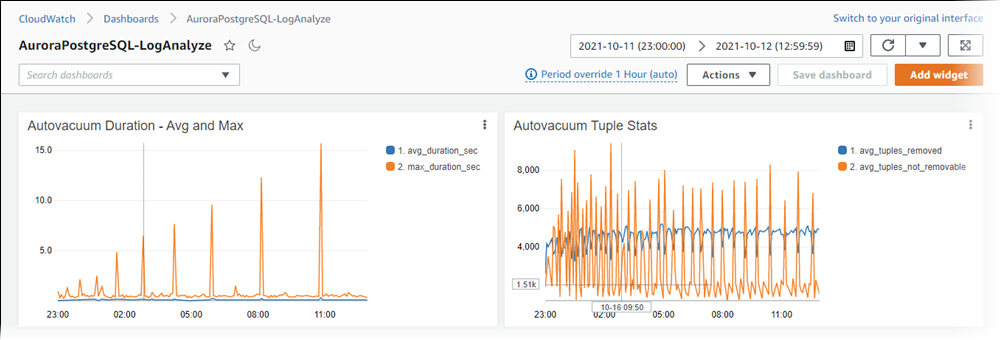
Your dashboard should look similar to the following image.

-