Nach reiflicher Überlegung haben wir beschlossen, Amazon Kinesis Data Analytics für SQL Anwendungen in zwei Schritten einzustellen:
1. Ab dem 15. Oktober 2025 können Sie keine neuen Kinesis Data Analytics für SQL Anwendungen erstellen.
2. Wir werden Ihre Anwendungen ab dem 27. Januar 2026 löschen. Sie können Ihre Amazon Kinesis Data Analytics for SQL Applications weder starten noch betreiben. SQLAb diesem Zeitpunkt ist kein Support mehr für Amazon Kinesis Data Analytics verfügbar. Weitere Informationen finden Sie unter Einstellung von Amazon Kinesis Data Analytics for SQL Applications.
Die vorliegende Übersetzung wurde maschinell erstellt. Im Falle eines Konflikts oder eines Widerspruchs zwischen dieser übersetzten Fassung und der englischen Fassung (einschließlich infolge von Verzögerungen bei der Übersetzung) ist die englische Fassung maßgeblich.
Schritt 4: Überprüfen der Anwendungsausgabe
In diesem Abschnitt des Hotspot-Beispiels richten Sie eine Webanwendung ein, die Hotspot-Informationen in einem Scalable Vector Graphics (SVG)-Steuerelement anzeigt.
-
Erstellen Sie eine Datei mit dem Namen
index.htmlund dem folgenden Inhalt:<!doctype html> <html lang=en> <head> <meta charset=utf-8> <title>hotspots viewer</title> <style> #visualization { display: block; margin: auto; } .point { opacity: 0.2; } .hot { fill: red; } .cold { fill: blue; } .hotspot { stroke: black; stroke-opacity: 0.8; stroke-width: 1; fill: none; } </style> <script src="https://sdk.amazonaws.com/js/aws-sdk-2.202.0.min.js"></script> <script src="https://d3js.org/d3.v4.min.js"></script> </head> <body> <svg id="visualization" width="600" height="600"></svg> <script src="hotspots_viewer.js"></script> </body> </html> -
Erstellen Sie in demselben Verzeichnis eine Datei namens
hotspots_viewer.jsmit folgendem Inhalt. Geben Sie Ihre Anmeldeinformationen und den Namen des Ausgabe-Streams in den bereitgestellten Variablen an.// Visualize example output from the Kinesis Analytics hotspot detection algorithm. // This script assumes that the output stream has a single shard. // Modify this section to reflect your AWS configuration var awsRegion = "", // The where your Kinesis Analytics application is configured. accessKeyId = "", // Your Access Key ID secretAccessKey = "", // Your Secret Access Key outputStream = ""; // The name of the Kinesis Stream where the output from the HOTSPOTS function is being written // The variables in this section should reflect way input data was generated and the parameters that the HOTSPOTS // function was called with. var windowSize = 1000, // The window size used for hotspot detection minimumDensity = 40, // A filter applied to returned hotspots before visualization xRange = [0, 10], // The range of values to display on the x-axis yRange = [0, 10]; // The range of values to display on the y-axis //////////////////////////////////////////////////////////////////////////////////////////////////////////////////////// // D3 setup //////////////////////////////////////////////////////////////////////////////////////////////////////////////////////// var svg = d3.select("svg"), margin = {"top": 20, "right": 20, "bottom": 20, "left": 20}, graphWidth = +svg.attr("width") - margin.left - margin.right, graphHeight = +svg.attr("height") - margin.top - margin.bottom; // Return the linear function that maps the segment [a, b] to the segment [c, d]. function linearScale(a, b, c, d) { var m = (d - c) / (b - a); return function(x) { return c + m * (x - a); }; } // helper functions to extract the x-value from a stream record and scale it for output var xValue = function(r) { return r.x; }, xScale = linearScale(xRange[0], xRange[1], 0, graphWidth), xMap = function(r) { return xScale(xValue(r)); }; // helper functions to extract the y-value from a stream record and scale it for output var yValue = function(r) { return r.y; }, yScale = linearScale(yRange[0], yRange[1], 0, graphHeight), yMap = function(r) { return yScale(yValue(r)); }; // a helper function that assigns a CSS class to a point based on whether it was generated as part of a hotspot var classMap = function(r) { return r.is_hot == "Y" ? "point hot" : "point cold"; }; var g = svg.append("g") .attr("transform", "translate(" + margin.left + "," + margin.top + ")"); function update(records, hotspots) { var points = g.selectAll("circle") .data(records, function(r) { return r.dataIndex; }); points.enter().append("circle") .attr("class", classMap) .attr("r", 3) .attr("cx", xMap) .attr("cy", yMap); points.exit().remove(); if (hotspots) { var boxes = g.selectAll("rect").data(hotspots); boxes.enter().append("rect") .merge(boxes) .attr("class", "hotspot") .attr("x", function(h) { return xScale(h.minValues[0]); }) .attr("y", function(h) { return yScale(h.minValues[1]); }) .attr("width", function(h) { return xScale(h.maxValues[0]) - xScale(h.minValues[0]); }) .attr("height", function(h) { return yScale(h.maxValues[1]) - yScale(h.minValues[1]); }); boxes.exit().remove(); } } //////////////////////////////////////////////////////////////////////////////////////////////////////////////////////// // Use the AWS SDK to pull output records from Kinesis and update the visualization //////////////////////////////////////////////////////////////////////////////////////////////////////////////////////// var kinesis = new AWS.Kinesis({ "region": awsRegion, "accessKeyId": accessKeyId, "secretAccessKey": secretAccessKey }); var textDecoder = new TextDecoder("utf-8"); // Decode an output record into an object and assign it an index value function decodeRecord(record, recordIndex) { var record = JSON.parse(textDecoder.decode(record.Data)); var hotspots_result = JSON.parse(record.HOTSPOTS_RESULT); record.hotspots = hotspots_result.hotspots .filter(function(hotspot) { return hotspot.density >= minimumDensity}); record.index = recordIndex return record; } // Fetch a new records from the shard iterator, append them to records, and update the visualization function getRecordsAndUpdateVisualization(shardIterator, records, lastRecordIndex) { kinesis.getRecords({ "ShardIterator": shardIterator }, function(err, data) { if (err) { console.log(err, err.stack); return; } var newRecords = data.Records.map(function(raw) { return decodeRecord(raw, ++lastRecordIndex); }); newRecords.forEach(function(record) { records.push(record); }); var hotspots = null; if (newRecords.length > 0) { hotspots = newRecords[newRecords.length - 1].hotspots; } while (records.length > windowSize) { records.shift(); } update(records, hotspots); getRecordsAndUpdateVisualization(data.NextShardIterator, records, lastRecordIndex); }); } // Get a shard iterator for the output stream and begin updating the visualization. Note that this script will only // read records from the first shard in the stream. function init() { kinesis.describeStream({ "StreamName": outputStream }, function(err, data) { if (err) { console.log(err, err.stack); return; } var shardId = data.StreamDescription.Shards[0].ShardId; kinesis.getShardIterator({ "StreamName": outputStream, "ShardId": shardId, "ShardIteratorType": "LATEST" }, function(err, data) { if (err) { console.log(err, err.stack); return; } getRecordsAndUpdateVisualization(data.ShardIterator, [], 0); }) }); } // Start the visualization init(); -
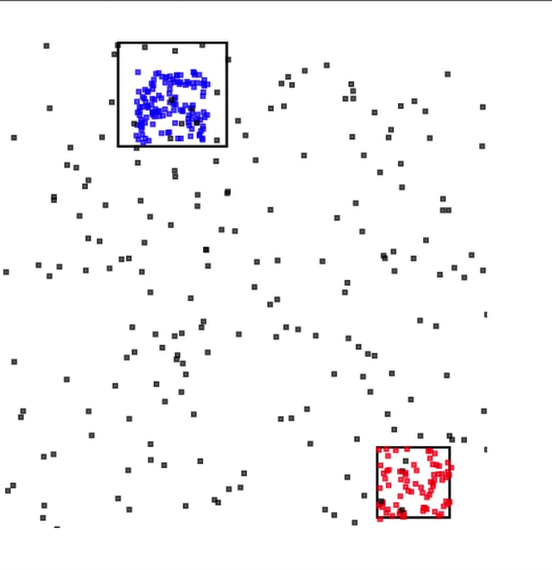
Öffnen Sie mit dem Python-Code aus dem ersten Abschnitt
index.htmlin einem Webbrowser. Wie im Folgenden verdeutlicht wird, erscheinen die Hotspot-Informationen auf der Seite.