Using dashboards
This documentation topic is designed for Grafana workspaces that support Grafana version 10.x.
For Grafana workspaces that support Grafana version 9.x, see Working in Grafana version 9.
For Grafana workspaces that support Grafana version 8.x, see Working in Grafana version 8.
This topic provides an overview of dashboard features and shortcuts, and describes how to use dashboard search.
Features
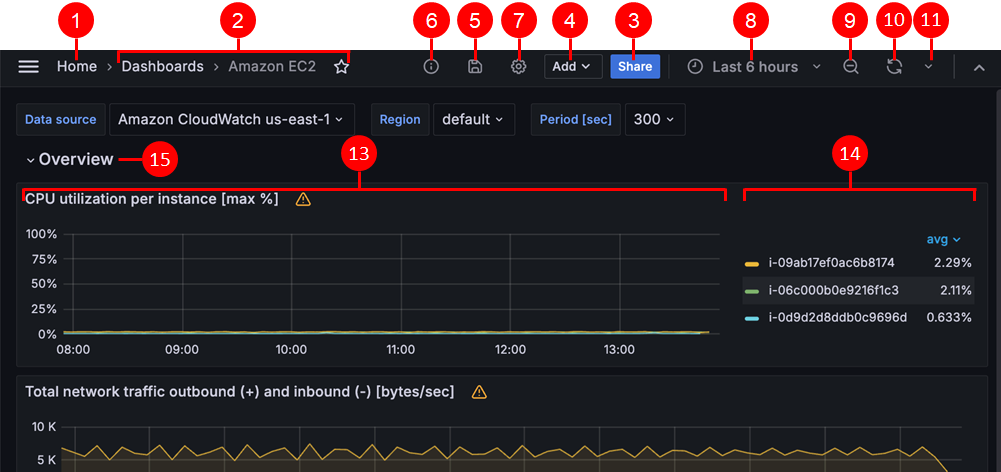
You can use dashboards to customize the presentation of your data. The following image shows the dashboard interface in the Amazon Managed Grafana workspace.
|
Feature |
Description |
|---|---|
1. Home |
Select the Grafana home icon to be redirected to the home page configured in the Grafana instance. |
2. Title |
When you select the dashboard title, you can search for dashboards contained in the current folder. |
3. Sharing a dashboard |
Use this option to share the current dashboard by link or snapshot. You can also export the dashboard definition from the share modal. |
4. Adding a new panel |
Use this option to add a panel, dashboard row, or library panel to the current dashboard. |
5. Save dashboard |
Choose the Save icon to save changes to your dashboard. |
6. Dashboard insights |
Choose to view analytics about your dashboard, including information about users, activity, and query counts. For more information, see Assessing dashboard usage. |
7. Dashboard settings |
Use this option to change the dashboard name, folder, or tags and manage variables and annotation queries. For more information about dashboard settings, see Modifying dashboard settings. |
8. Time picker dropdown |
Use to select relative time range options and set custom absolute time ranges. You can change the Timezone and fiscal year settings from the time range controls by clicking the Change time settings button. Time settings are saved on a per-dashboard basis. |
9. Zoom out time range |
Use to zoom out the time range. For more information about how to use time range controls, see Setting dashboard time range. |
10. Refresh dashboard |
Select to immediately trigger queries and refresh dashboard data. |
11. Refresh dashboard time interval |
Select a dashboard auto refresh time interval. |
12. View mode |
Select to display the dashboard on a large screen such as a TV or a kiosk. View mode hides irrelevant information such as navigation menus. |
13. Dashboard panel |
The primary building block of a dashboard is the panel. To add a new panel, dashboard row, or library panel, select Add panel.
|
14. Graph legend |
Change series colors, y-axis, and series visibility directly from the legend. |
15. Dashboard row |
A dashboard row is a logical divider within a dashboard that groups panels together.
|
Keyboard shortcuts
Grafana has a number of keyboard shortcuts available. To display all keyboard shortcuts available to you, press ? or h on your keyboard.
-
Ctrl+Ssaves the current dashboard. -
fopens the dashboard finder/search. -
d+ktoggles kiosk mode (hides the menu). -
d+eexpands all rows. -
d+sopens dashboard settings. -
Ctrl+Kopens the command palette. -
Escexits panel when in fullscreen view or edit mode. Also returns you to the dashboard from the dashboard settings.
Focused panel
To use shortcuts targeting a specific panel, hover over a panel with your pointer.
-
etoggles panel edit view -
vtoggles panel fullscreen view -
psopens panel share feature -
pdduplicates panel -
prremoves panel -
pltoggles panel legend
Setting dashboard time range
Grafana provides several ways to manage the time ranges of the data being visualized, for dashboard, panels and also for alerting.
This section describes supported time units and relative ranges, the common time controls, dashboard-wide time settings, and panel-specific time settings.
Time units and relative ranges
Grafana supports the following time units: s (seconds), m
(minutes), h (hours), d (days), w
(weeks), M (months), Q (quarters), and y
(years).
The minus operator enables you to step back in time, relative to the current date
and time, or now. If you want
to display the full period of the unit (day, week, or month), append /<time
unit> to the end. To view fiscal periods, use fQ (fiscal
quarter) and fy (fiscal year) time units.
The plus operator enables you to step forward in time, relative to now. For example, you can use this feature to look at predicted data in the future.
The following table provides example relative ranges.
| Example relative range | From | To |
|---|---|---|
Last 5 minutes |
|
|
The day so far |
|
|
This week |
|
|
This week so far |
|
|
This month |
|
|
This month so far |
|
|
Previous Month |
|
|
This year so far |
|
|
This Year |
|
|
Previous fiscal year |
|
|
Note
Grafana Alerting does not support the following syntaxes:
-
now+nfor future timestamps. -
now-1n/nfor start of n until end of n, because this is an absolute timestamp.
Common time range controls
The dashboard and panel time controls have a common user interface. The following describes common time range controls.
-
Current time range, also called the time picker, shows the time range currently displayed in the dashboard or panel you are viewing. Hover your cursor over the field to see the exact time stamps in the range and their source (such as the local browser time). Click the current time range to change it. You can change the current time using a relative time range, such as the last 15 minutes, or an absolute time range, such as
2020-05-14 00:00:00to2020-05-15 23:59:59. -
The relative time range can be selected from the Relative time ranges list. You can filter the list using the input field at the top. Some examples of time ranges include Last 30 minutes, Last 12 hours, Last 7 days, Last 2 years, Yesterday, Day before yesterday, This day last week, Today so far, This week so far, and This month so far.
-
Absolute time range can be set in two ways: Typing exact time values or relative time values into the From and To fields and clicking Apply time range, or clicking a date or date range from the calendar displayed when you click the From or To field. To apply your selections, click Apply time range. You can also choose from a list of recently used absolute time ranges.
-
Semi-relative time range can be selected in the absolute time range settings. For example, to show activity since a specific date, you can choose an absolute time for the start time, and a relative time (such as
now) for the end time.Using a semi-relative time range, as time progresses, your dashboard will automatically and progressively zoom out to show more history and fewer details. At the same rate, as high data resolution decreases, historical trends over the entire time period will become more clear.
Note
Alerting does not support semi-relative time ranges.
-
Zoom out by selecting the zoom out icon (or by using Cmd+Z or Ctrl+Z as a keyboard shortcut). This increases the view, showing a larger time range in the dashboard or panel visualization.
-
Zoom in by selecting a time range you want to view on the graph in the visualization.
Note
Zooming in is only applicable to graph visualizations.
Refresh dashboards
Click the Refresh dashboard icon to immediately run every query on the dashboard and refresh the visualizations. Grafana cancels any pending requests when you trigger a refresh.
By default, Grafana does not automatically refresh the dashboard. Queries run on their own schedule according to the panel settings. However, if you want to regularly refresh the dashboard, then click the down arrow next to the Refresh dashboard icon and then select a refresh interval.
Control the time range using a URL
You can control the time range of a dashboard by providing the following query parameters in the dashboard URL.
-
fromdefines the lower limit of the time range, specified in ms epoch, or relative time. -
todefines the upper limit of the time range, specified in ms epoch, or relative time. -
timeandtime.windowdefines a time range fromtime-time.window/2totime+time.window/2. Both parameters should be specified in ms. For example?time=1500000000000&time.window=10000results in 10s time range from 1499999995000 to 1500000005000.
