Monitoring Lambda Web Functions
AWS Lambda Web Functions publish metrics and logs to Amazon CloudWatch. Use them to identify performance bottlenecks, debug errors, and set alarms that alert you when error rates spike during canary deployments or traffic shifts.
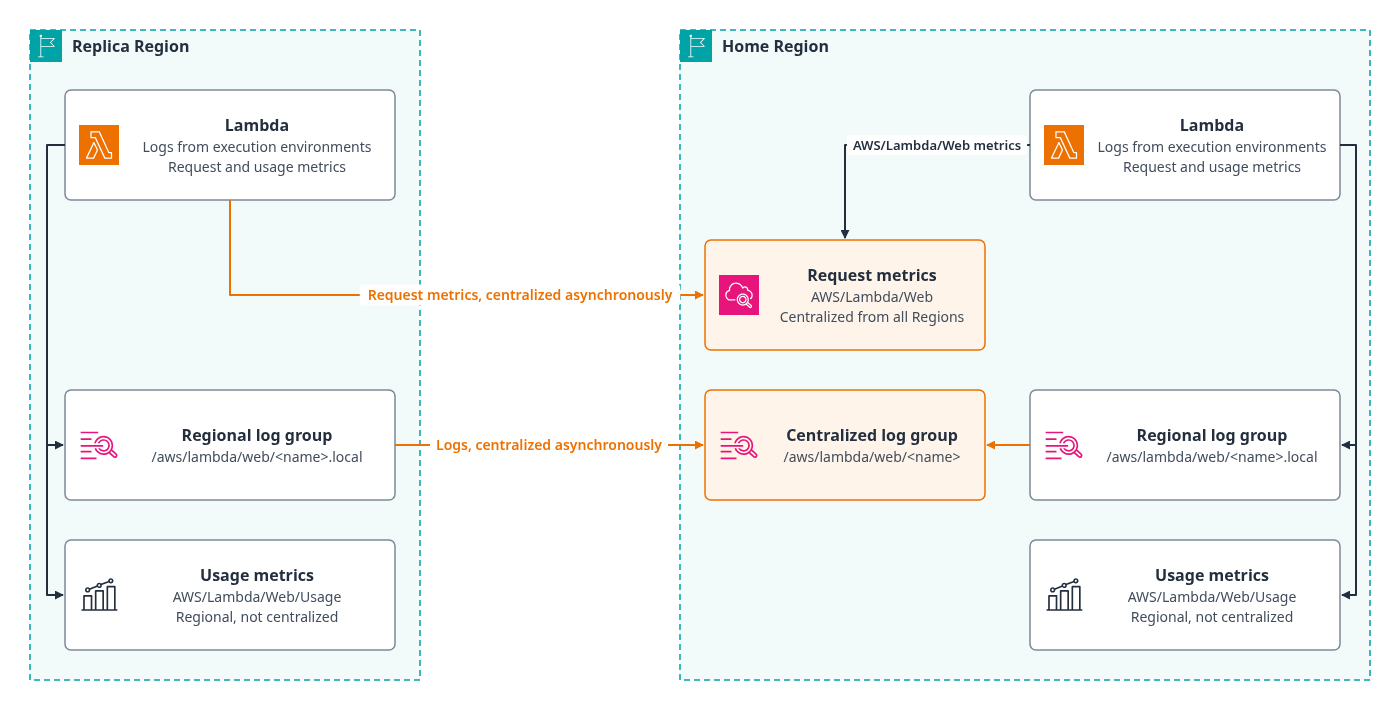
For a Web Function that serves requests in more than one AWS Region, Lambda collects metrics and logs in each Region where requests run. It centralizes request metrics and logs into the Web Function's home Region, so you can monitor the whole application from one place. Usage and throttling metrics stay in the Region where they are emitted, because the quotas they describe apply per Region.
Each type of telemetry answers a different question:
-
Metrics – Track how your Web Function performs over time, and alarm on problems. For details, see Using CloudWatch metrics with Lambda Web Functions.
-
Logs – Investigate individual requests and errors. For details, see Web Function logs in Amazon CloudWatch Logs.
-
Custom metrics – Publish your own application metrics by writing the embedded metric format to your logs. For details, see Publishing custom metrics with the embedded metric format.
-
CloudTrail – Record API calls for your Web Functions, including invocations, which CloudTrail logs as data events. For details, see Logging Web Function API calls using AWS CloudTrail.
To troubleshoot in the Region where a request ran, use the Regional log group
/aws/lambda/web/, where execution
environments write logs. Lambda centralizes
the logs asynchronously to the function-name.local/aws/lambda/web/
log group in the home Region. For information about home Regions and replication, see
Multi-Region deployment.function-name
The following diagram shows how Lambda writes and centralizes telemetry across Regions.
Request metrics in the AWS/Lambda/Web namespace and logs are centralized in
the home Region. Usage metrics in the AWS/Lambda/Web/Usage namespace stay in
each Region.
Topics
Telemetry billing
Telemetry for Web Functions is billed as follows:
| Telemetry | Billing |
|---|---|
| Metrics published by Lambda | Free. Lambda publishes the metrics in the AWS/Lambda/Web
and AWS/Lambda/Web/Usage namespaces at no charge to you. |
| Logs | You pay standard Amazon CloudWatch Logs charges to write and store logs in the
.local log group in each Region. You also pay to store the copies in
the centralized log group in the home Region. Lambda copies each log event to the
home Region at no charge. The first centralization of the log event is
free. |
| Custom metrics | Custom metrics that you publish using the embedded metric format incur Amazon CloudWatch Logs ingestion charges and CloudWatch custom metric charges. The first centralization of the log event is free. For more information, see Publishing custom metrics with the embedded metric format. |
For current prices, see Amazon CloudWatch
pricing
Telemetry considerations
Review the following behaviors before you build dashboards, alarms, or automation on Web Function telemetry.
AWS X-Ray tracing
If a request includes an X-Amzn-Trace-Id header, Lambda passes it
to your application unchanged. Lambda does not add a trace header to requests that do
not include one, and Web Functions do not create Lambda service segments. Because
callers set this header, treat its value as client input. To record traces, send
trace data from your code directly to X-Ray, for example with the AWS Distro for OpenTelemetry, and
give your execution role permission to write to X-Ray.
Centralization latency
Metrics and logs reach the home Region asynchronously. In steady state, Lambda typically centralizes metrics and logs within a few minutes. Telemetry can arrive later during a service disruption.
When you create an endpoint that runs in more than one Region, Lambda sets up metric centralization for each replica Region. CloudWatch can take several minutes after the endpoint becomes active in a Region to start centralizing its metrics from that Region. Metrics emitted before then remain only in that Region and are not added to the home Region later.
Account for this latency in deployment automation. If a pipeline creates a Web Function or an endpoint and then immediately checks metrics or logs in the home Region, allow time for the first telemetry to arrive rather than treating its absence as a failure.
Telemetry in each Region
Lambda writes telemetry in every Region where requests run and then centralizes part of it into the home Region. What you can rely on in each Region depends on the type of telemetry:
- Request metrics (
AWS/Lambda/Web) -
Lambda can also write these metrics in other Regions where requests run. They can change or be removed without notice, so we recommend that you don't rely on them and instead use the centralized values in the home Region for alarms, dashboards, and automation. The centralized values include requests from every Region that the endpoint serves.
- Usage and throttling metrics (
AWS/Lambda/Web/Usage) -
These metrics exist only in the Region where the request was served. Alarm on them in each Region. For details, see Regional usage and throttling metrics.
- Logs
-
In each Region, the
.locallog group holds the logs from that Region only. These logs are available before centralization completes and are not affected by centralization delays, which makes them useful for debugging a Regional issue. The centralized log group in the home Region holds logs from every Region. Build shared queries, subscriptions, and retention policies on the centralized log group. For details, see Log groups.
Service disruptions
Infrastructure disruptions, such as an Availability Zone outage, can delay
telemetry, and some metrics and log events may be lost. If the home Region is
impaired, centralized metrics and logs in the home Region can be delayed or
unavailable. Usage metrics and .local log groups in other Regions do
not depend on centralization and continue to receive telemetry from those
Regions.
Telemetry is emitted on a best-effort basis. On rare occasions, telemetry may be dropped or duplicated. Do not treat Web Function telemetry as an audit record. To audit configuration changes and invocations, use AWS CloudTrail. For more information, see Logging Web Function API calls using AWS CloudTrail.
Required permissions
Logging requires the Amazon CloudWatch Logs permissions logs:CreateLogGroup,
logs:CreateLogStream, and logs:PutLogEvents in your Web
Function's execution role. Without them, Lambda cannot create log groups or write log
events, and your application's output is lost. For an example policy, see
Execution role.
Lambda publishes the metrics in the AWS/Lambda/Web and
AWS/Lambda/Web/Usage namespaces itself, so they need no permission in the
execution role, including cloudwatch:PutMetricData. The embedded metric format also does not call PutMetricData directly, but
it requires the same Amazon CloudWatch Logs permissions, because Lambda extracts the metrics
from your log events.
