Monitoring Aurora PostgreSQL Limitless Database with Performance Insights
Use Performance Insights to monitor your Aurora PostgreSQL Limitless Database cluster. Performance Insights works similarly for Aurora PostgreSQL Limitless Database as it does for standard Aurora DB clusters. However, you track metrics at the shard group level for Aurora PostgreSQL Limitless Database.
The two main Performance Insights metrics to track are the following:
-
Database load – Measures the level of activity in your database. The key metric in Performance Insights is
DBLoad, which is collected every second.The unit for the
DBLoadmetric in Performance Insights is average active sessions (AAS). To get the average active sessions, Performance Insights samples the number of sessions concurrently running a query. The AAS is the total number of sessions divided by the total number of samples for a specific time period. For more information onDBLoadand AAS, see Database load. -
Maximum CPU – The maximum computational power available to your database. To see whether active sessions are exceeding the maximum CPU, look at their relationship to the
Max vCPUline. TheMax vCPUvalue is determined by the number of vCPU (virtual CPU) cores for your DB instance. For more information onMax vCPU, see Maximum CPU.
In addition, you can "slice" the DBLoad metric into dimensions, which are subcategories of
the metric. The two most useful dimensions are the following:
-
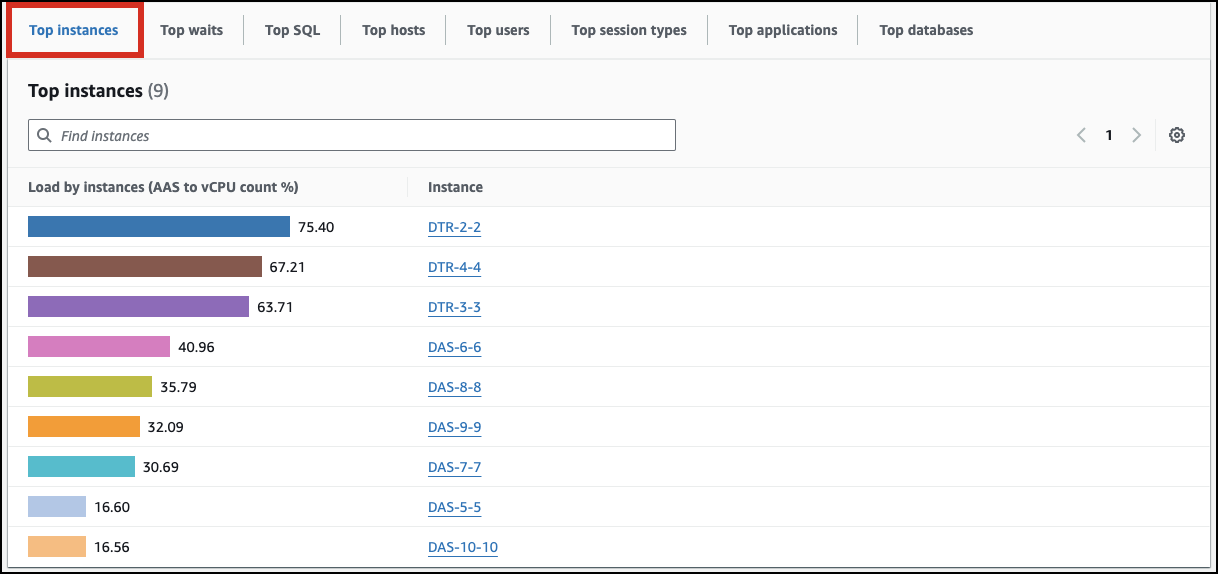
Top instances – Shows the relative DB load for your instances (shards and routers) in descending order.
-
Wait events – Cause SQL statements to wait for specific events to happen before they can continue running. Wait events indicate where work is impeded.
-
Top SQL – Shows which queries contribute the most to DB load.
For more information, see Dimensions.
The following figure shows the Top instances dimension for a DB shard group.
