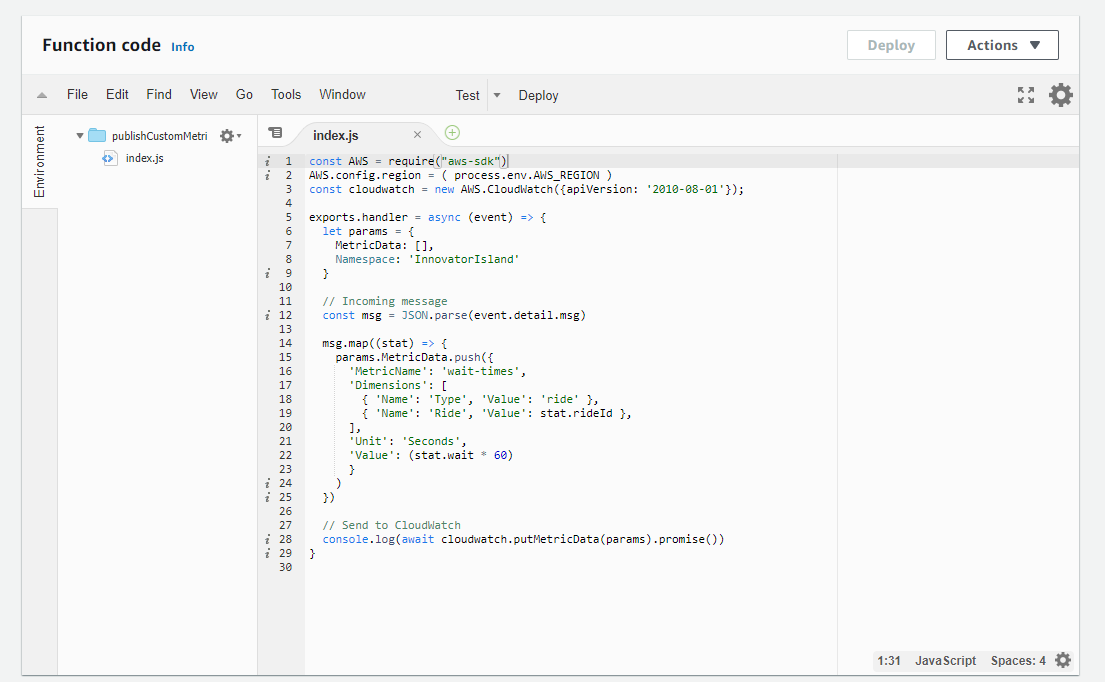
Custom metrics
CloudWatch can also track custom metrics that are application-specific. By default, metrics from AWS services are stored with “standard resolution”, which provides a one-minute granularity. You can define custom metrics as either standard or high resolution, which provides a one-second granularity. High-resolution metrics provide more immediate insight into subminute activity, and can be used to generate alarms more quickly, based upon 10-second or 30-second activity. You can develop graphs, dashboards, and statistical analysis on custom metrics in the same way as you can for AWS-generated metrics.
Custom metrics can be used for tracking statistics in the application domain, instead of measuring performance related to the Lambda function (for example, duration). A single statistic may have multiple dimensions to use for later analysis. Each custom metric must be published to a namespace, which isolates groups of custom metrics, so often a namespace equates to an application or workload domain.
You can use the Embedded Metrics format to embed custom metrics alongside detailed log event data. CloudWatch automatically extracts the custom metrics so you can visualize and alarm on them, for real-time incident detection. For example, the Innovator Island workshop
