翻訳は機械翻訳により提供されています。提供された翻訳内容と英語版の間で齟齬、不一致または矛盾がある場合、英語版が優先します。
トレーニング中にメトリクス、パラメータ、MLflow モデルをログに記録する
MLflow 追跡サーバーに接続したら、MLflow SDK を使用して、メトリクス、パラメータ、MLflow モデルをログに記録できます。
トレーニングメトリクスをログに記録する
MLflow トレーニングの実行 (run) 内で mlflow.log_metric を使用して、メトリクスを追跡します。MLflow を利用したメトリクスのログ記録の詳細については、「mlflow.log_metric」を参照してください。
with mlflow.start_run(): mlflow.log_metric("foo",1) print(mlflow.search_runs())
このスクリプトは、実験の実行を作成し、次のような出力を生成します。
run_id experiment_id status artifact_uri ... tags.mlflow.source.name tags.mlflow.user tags.mlflow.source.type tags.mlflow.runName
0 607eb5c558c148dea176d8929bd44869 0 FINISHED s3://dddd/0/607eb5c558c148dea176d8929bd44869/a... ... file.py user-id LOCAL experiment-code-name
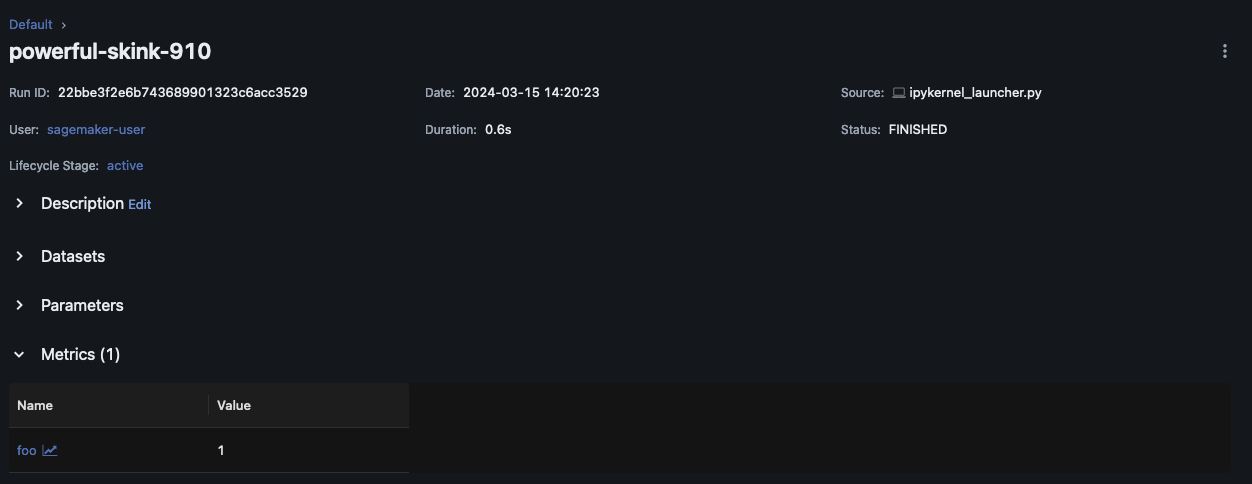
MLflow UI 内では、このサンプルは次のように表示されます。
![最上位の MLflow の [Experiments] メニューに実験が表示されています。](images/mlflow/mlflow-ui-experiments.png)
[Run Name] を選択すると、実行の詳細が表示されます。
パラメータとモデルをログに記録する
注記
次のサンプルを実行するには、ご利用の環境に s3:PutObject アクセス許可が必要です。このアクセス許可は、MLflow SDK ユーザーが AWS アカウントにログインまたはフェデレーションするときに引き受ける IAM ロールに関連付ける必要があります。詳細については、ユーザーとロールのポリシーの例を参照してください。
次の例は、SKLearn を使用した基本的なモデルトレーニングのワークフローを説明し、MLflow の実験実行でそのモデルを追跡する方法を示しています。この例では、パラメータ、メトリクス、モデルアーティファクトをログに記録します。
import mlflow from mlflow.models import infer_signature import pandas as pd from sklearn import datasets from sklearn.model_selection import train_test_split from sklearn.linear_model import LogisticRegression from sklearn.metrics import accuracy_score, precision_score, recall_score, f1_score # This is the ARN of the MLflow Tracking Server you created mlflow.set_tracking_uri(your-tracking-server-arn) mlflow.set_experiment("some-experiment") # Load the Iris dataset X, y = datasets.load_iris(return_X_y=True) # Split the data into training and test sets X_train, X_test, y_train, y_test = train_test_split(X, y, test_size=0.2, random_state=42) # Define the model hyperparameters params = {"solver": "lbfgs", "max_iter": 1000, "multi_class": "auto", "random_state": 8888} # Train the model lr = LogisticRegression(**params) lr.fit(X_train, y_train) # Predict on the test set y_pred = lr.predict(X_test) # Calculate accuracy as a target loss metric accuracy = accuracy_score(y_test, y_pred) # Start an MLflow run and log parameters, metrics, and model artifacts with mlflow.start_run(): # Log the hyperparameters mlflow.log_params(params) # Log the loss metric mlflow.log_metric("accuracy",accuracy) # Set a tag that we can use to remind ourselves what this run was for mlflow.set_tag("Training Info","Basic LR model for iris data") # Infer the model signature signature = infer_signature(X_train, lr.predict(X_train)) # Log the model model_info = mlflow.sklearn.log_model( sk_model=lr, artifact_path="iris_model", signature=signature, input_example=X_train, registered_model_name="tracking-quickstart", )
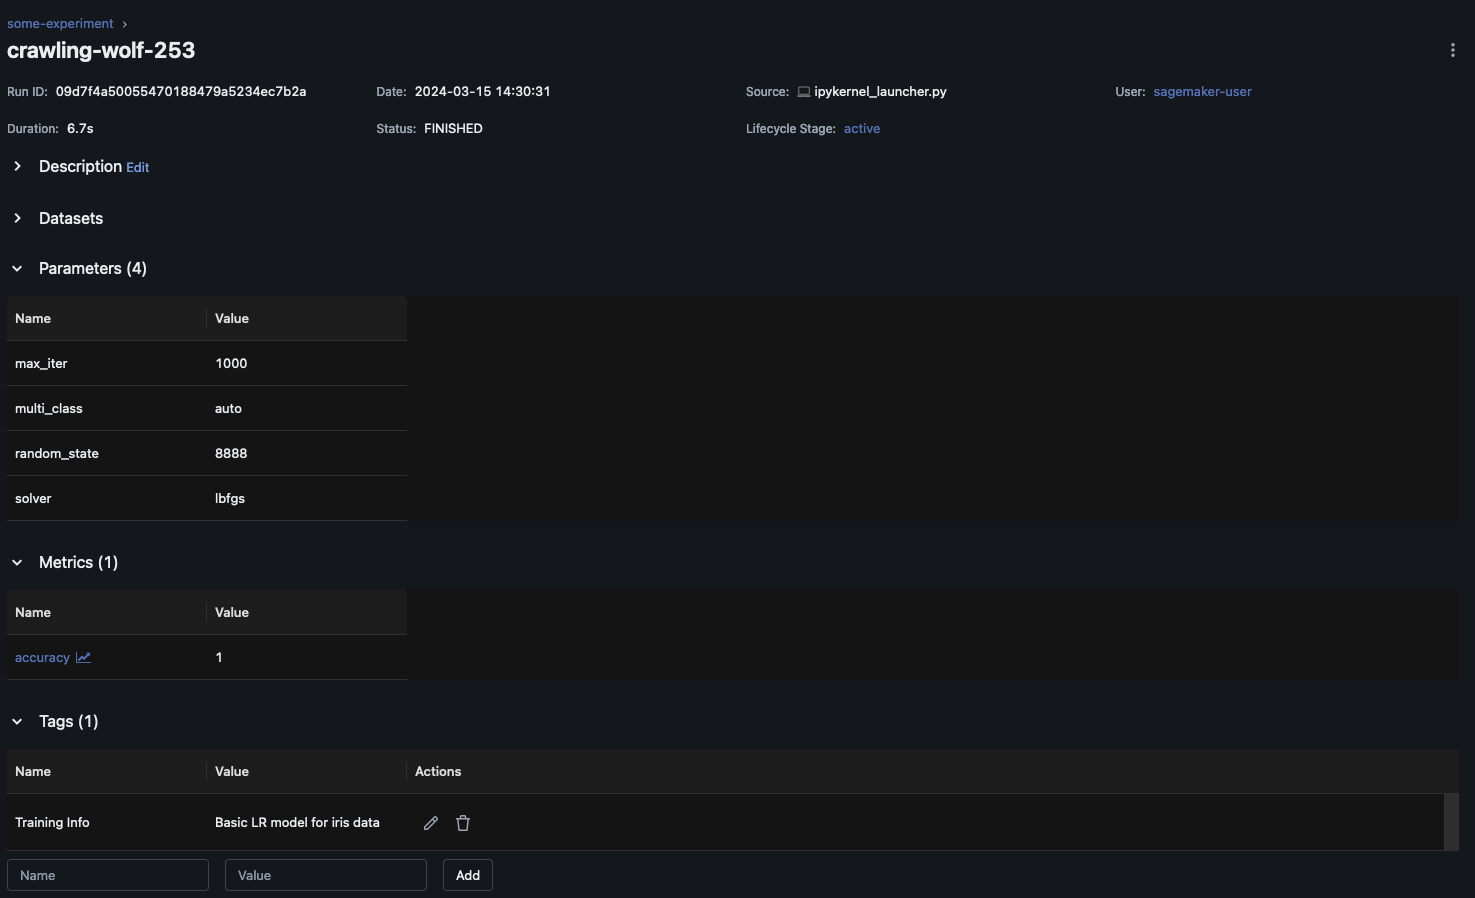
MLflow UI 内で、左側のナビゲーションペインで実験名を選択して、関連するすべての実行を調べます。[Run Name] を選択すると、各実行に関する詳細情報が表示されます。この例の場合、この実行の実験実行ページは次のように表示されます。
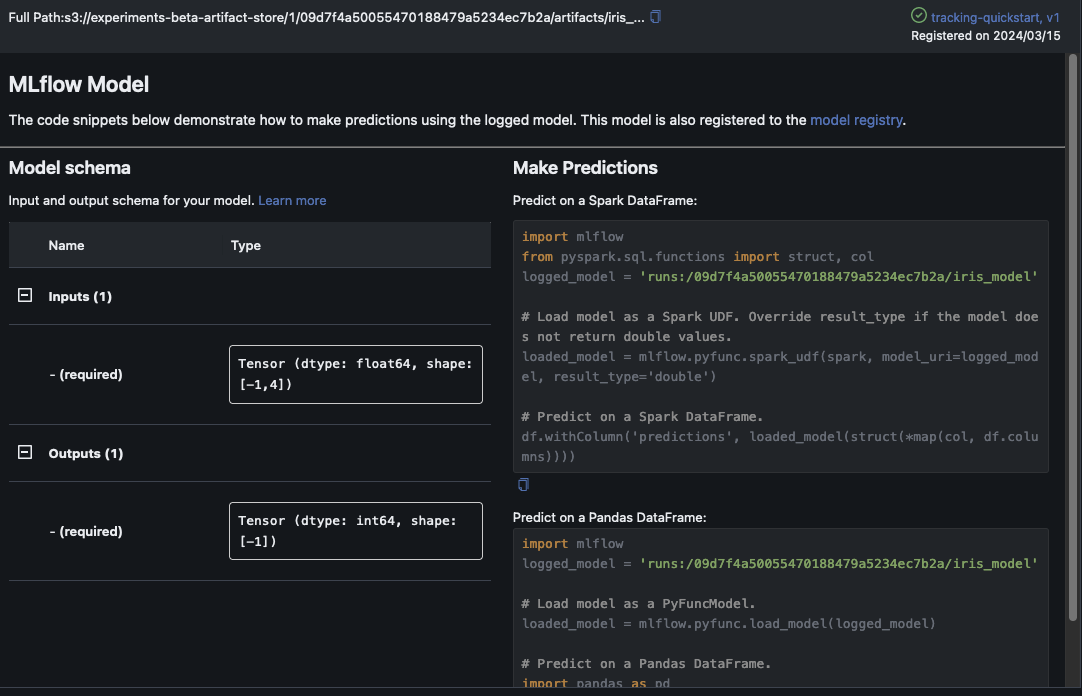
この例では、ロジスティック回帰モデルをログに記録しています。MLflow UI 内には、ログに記録されたモデルアーティファクトも表示されます。