Configuring the CloudWatch agent for EC2 instances and on-premises servers
Many organizations run workloads on both physical servers and virtual machines (VMs). These workloads typically run on different OSs that each have unique installation and configuration requirements for capturing and ingesting metrics.
If you choose to use EC2 instances, you can have a high level of control over your instance and OS configuration. However, this higher level of control and responsibility requires you to monitor and adjust configurations to achieve more efficient usage. You can improve your operational effectiveness by establishing standards for logging and monitoring, and applying a standard installation and configuration approach for capturing and ingesting logs and metrics.
Organizations that migrate or extend their IT investments to the AWS Cloud can leverage CloudWatch to achieve a unified logging and monitoring solution. CloudWatch pricing means that you incrementally pay for the metrics and logs that you want to capture. You can also capture logs and metrics for on-premises servers by using a similar CloudWatch agent installation process as that for Amazon EC2.
Before you begin installing and deploying CloudWatch, make sure that you evaluate the logging and metric configurations for your systems and applications. Ensure that you define the standard logs and metrics that you need to capture for the OSs that you want to use. System logs and metrics are the foundation and standard for a logging and monitoring solution because they are generated by the OS and are different for Linux and Windows. There are important metrics and log files available across Linux distributions, in addition to those that are specific to a Linux version or distribution. This variance also occurs between different Windows versions.
Configuring the CloudWatch agent
CloudWatch captures metrics and logs for Amazon EC2 and on-premises servers by using CloudWatch agents and agent configuration files that are specific to each OS. We recommend that you define your organization's standard metric and log capture configuration before you begin installing the CloudWatch agent at scale in your accounts.
You can combine multiple CloudWatch agent configurations to form a composite CloudWatch agent configuration. One recommended approach is to define and divide configurations for your logs and metrics at the system and application level. The following diagram illustrates how multiple CloudWatch configuration file types for different requirements can be combined to form a composite CloudWatch configuration:

These logs and metrics can also be further classified and configured for specific environments or requirements. For example, you could define a smaller subset of logs and metrics with lower precision for unregulated development environments, and a larger, more complete set with higher precision for regulated production environments.
Configuring log capture for EC2 instances
By default, Amazon EC2 doesn't monitor or capture log files. Instead, log files are captured and ingested into CloudWatch Logs by the CloudWatch agent software installed on your EC2 instance, AWS API, or AWS Command Line Interface (AWS CLI). We recommend using the CloudWatch agent to ingest log files into CloudWatch Logs for Amazon EC2 and on-premises servers.
You can search and filter logs, as well as extract metrics and run automation based on pattern patching from log files in CloudWatch. CloudWatch supports plaintext, space delimited, and JSON-formatted filter and pattern syntax options, with JSON-formatted logs providing the most flexibility. To increase the filtering and analysis options, you should use a formatted log output instead of plain text.
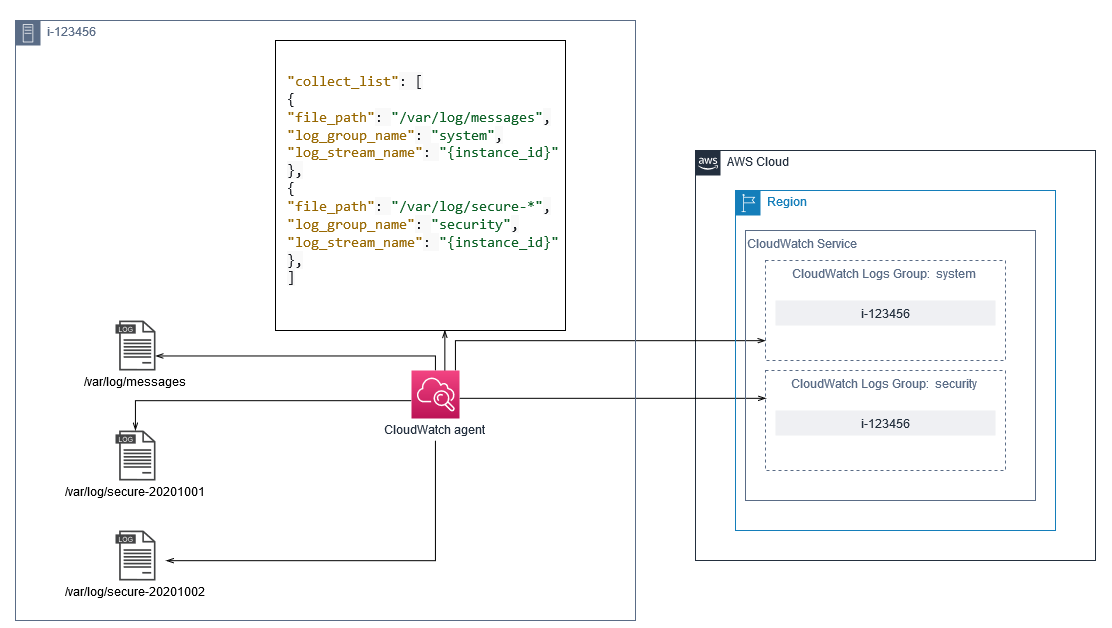
The CloudWatch agent uses a configuration file that defines the logs and metrics to send to CloudWatch. CloudWatch then captures each log file as a log stream and groups these log streams into a log group. This helps you perform operations across logs from your EC2 instances, such as searching for a matching string.
The default log stream name is the same as the EC2 instance ID and the default log group
name is the same as the log file path. The log stream's name must be unique within the CloudWatch log
group. You can use instance_id, hostname, local_hostname,
or ip_address for dynamic substitution in the log stream and log group names, which
means that you can use the same CloudWatch agent configuration file across multiple EC2 instances.
The following diagram shows a CloudWatch agent configuration for capturing logs. The log group is
defined by the captured log files and contains separate log streams for each EC2 instance because
the {instance_id} variable is used for the log stream name and EC2 instance IDs are
unique.
Log groups define the retention, tags, security, metric filters, and search scope for the log streams that they contain. The default grouping behavior based on the log file name helps you search, create metrics, and alarm on data that is specific to a log file across EC2 instances in an account and Region. You should evaluate whether further log group refinement is required. For example, your account might be shared by multiple business units and have different technical or operations owners. This means that you must further refine the log group name to reflect the separation and ownership. This approach allows you to concentrate your analysis and troubleshooting on the relevant EC2 instance.
If multiple environments use one account, you can separate the logging for workloads that run in each environment. The following table shows a log group naming convention that includes the business unit, project or application, and environment.
| Log group name | /<Business unit>/<Project or application name>/<Environment>/<Log
file name> |
| Log stream name | <EC2 instance ID>
|
You can also group all log files for an EC2 instance into the same log group. This makes it easier to search and analyze across a set of log files for a single EC2 instance. This is useful if most of your EC2 instances service one application or workload and each EC2 instance serves a specific purpose. The following table shows how your log group and log stream naming could be formatted to support this approach.
| Log group name | /<Business unit>/<Project or application name>/<Environment>/<EC2
instance ID> |
| Log stream name | <Log file name> |
Configuring metrics capture for EC2 instances
By default, your EC2 instances are enabled for basic monitoring and a standard set of metrics (for example, CPU, network, or storage-related metrics) is automatically sent to CloudWatch every five minutes. CloudWatch metrics can vary depending on the instance family, for example, burstable performance instances have metrics for CPU credits. Amazon EC2 standard metrics are included in your instance price. If you enable detailed monitoring for your EC2 instances, you can receive data in one-minute periods. The period frequency impacts your CloudWatch costs, so make sure that you evaluate whether detailed monitoring is required for all or only some of your EC2 instances. For example, you could enable detailed monitoring for production workloads but use basic monitoring for non-production workloads.
On-premises servers don't include any default metrics for CloudWatch and must use the CloudWatch agent, AWS CLI, or AWS SDK to capture metrics. This means that you must define the metrics that you want to capture (for example, CPU utilization) in the CloudWatch configuration file. You can create a unique CloudWatch configuration file that includes the standard EC2 instance metrics for your on-premises servers and apply it in addition to your standard CloudWatch configuration.
Metrics in CloudWatch are
uniquely defined by metric name and zero or more dimensions, and are uniquely grouped in a metric
namespace. Metrics provided by an AWS service have a namespace that begins with
AWS (for example, AWS/EC2), and non-AWS metrics are considered
custom metrics. Metrics that you configure and capture with the CloudWatch agent are all considered
custom metrics. Because the number of created metrics impacts your CloudWatch costs, you should
evaluate whether each metric is required for all or only some of your EC2 instances. For example,
you could define a complete set of metrics for production workloads but use a smaller subset of
these metrics for non-production workloads.
CWAgent is the default namespace for metrics published by the CloudWatch agent.
Similar to log groups, the metric namespace organizes a set of metrics so that they can be found
together in one place. You should modify the namespace to reflect a business unit, project or
application, and environment (for example, /<Business unit>/<Project or application
name>/<Environment>). This approach is useful if multiple unrelated workloads use the
same account. You can also correlate your namespace naming convention to your CloudWatch log group
naming convention.
Metrics are also identified by their dimensions, which help you analyze them against a set
of conditions and are the properties that observations are recorded against. Amazon EC2 includes
separate metrics for EC2 instances with InstanceIdand
AutoScalingGroupName dimensions. You also receive metrics with the
ImageId and InstanceType dimensions if you enable detailed monitoring.
For example, Amazon EC2 provides a separate EC2 instance metric for the CPU utilization with the
InstanceId dimensions, in addition to separate CPU utilization metric for the
InstanceType dimension. This helps you analyze CPU utilization for each unique EC2
instance, in addition to all EC2 instances of a specific instance type.
Adding more dimensions increases your analysis capability but also increases your overall
costs, because each metric and unique dimension value combination results in a new metric. For
example, if you create a metric for the memory utilization percentage against the
InstanceId dimension, then this is a new metric for each EC2 instance. If your
organization runs thousands of EC2 instances, this causes thousands of metrics and results in
higher costs. To control and predict costs, make sure that you determine the metric's cardinality
and which dimensions add the most value. For example, you could define a complete set of
dimensions for your production workload metrics but a smaller subset of these dimensions for
non-production workloads.
You can use the append_dimensions property to add dimensions to one or all
metrics defined in your CloudWatch configuration. You can also dynamically append the
ImageId, InstanceId, InstanceType, and
AutoScalingGroupName to all metrics in your CloudWatch configuration. Alternatively, you
can append an arbitrary dimension name and value for specific metrics by using the
append_dimensions property on that metric. CloudWatch can also aggregate statistics on
metric dimensions that you defined with the aggregation_dimensions property.
For example, you could aggregate the memory used against the InstanceType
dimension to see the average memory used by all EC2 instances for each instance type. If you use
t2.micro instances running in a Region, you could determine if workloads using the
t2.micro class are overutilizing or underutilizing the memory provided.
Underutilization might be a sign of workloads using EC2 classes with an unrequired memory
capacity. In contrast, overutilization might be a sign of workloads using Amazon EC2 classes with
insufficient memory.
The following diagram shows a sample CloudWatch metrics configuration that uses a custom
namespace, added dimensions, and aggregation by InstanceType.

