| Applies to: Enterprise Edition and Standard Edition |
| Intended audience: System administrators |
Use this section to learn how to explore AWS data in Amazon QuickSight using the AWS Management Console. Using the Explore in QuickSight shortcut, you can access a customizable dashboard template showing your data. Just as with any Amazon QuickSight dashboard, this dashboard can be refreshed on a schedule, published, and shared with other users in your organization.
To use this feature, you must first enable Amazon S3 analytics storage class analysis for your Amazon S3 buckets. For more on enabling storage class analysis in Amazon S3, see Amazon Amazon S3 analytics – Storage class analysis in the Amazon Amazon S3 Developer Guide.
After you have enabled storage class analysis, you can use Amazon QuickSight to explore your Amazon S3 analytics data.
To explore Amazon S3 analytics data in Amazon QuickSight
Open the Amazon S3 console at https://console.aws.amazon.com/s3/
. -
Choose a bucket to explore. The bucket must have storage class analysis enabled, with at least one filter.
-
Choose the Management tab.
-
Then choose Analytics.
-
Choose Explore in QuickSight.
Note
If you don't have an Amazon QuickSight account, you're prompted to create one before you can use the dashboard.

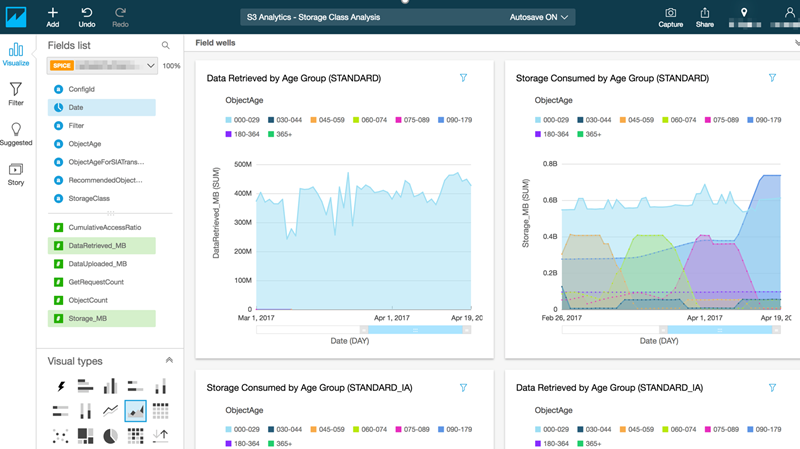
When you choose the option to explore in Amazon QuickSight, your Amazon S3 analytics data is automatically loaded into the dashboard template. The dashboard contains multiple visualizations to help you to understand the storage access pattern of your bucket.
Use the template as is, or customize it to suit your needs. For example, one visual on the default template helps you identify infrequently accessed data. It compares the amount of data retrieved to the amount of storage consumed, for objects of different ages.

You can also add your own visualizations to the dashboard. For example, you can break down the data access patterns, using filters for storage class analysis that you already have defined in Amazon S3 analytics.
To learn more about using S3 analytics and storage class analysis, see Amazon Amazon S3 analytics – Storage class analysis in the Amazon Amazon S3 Developer Guide.