Select your cookie preferences

We use essential cookies and similar tools that are necessary to provide our site and services. We use performance cookies to collect anonymous statistics, so we can understand how customers use our site and make improvements. Essential cookies cannot be deactivated, but you can choose “Customize” or “Decline” to decline performance cookies.

If you agree, AWS and approved third parties will also use cookies to provide useful site features, remember your preferences, and display relevant content, including relevant advertising. To accept or decline all non-essential cookies, choose “Accept” or “Decline.” To make more detailed choices, choose “Customize.”

Geospatial heatmaps in Amazon QuickSight

Focus mode
Geospatial heatmaps in Amazon QuickSight - Amazon QuickSight

Use geospatial heatmaps to reveal patterns of marker concentration in your geospatial visuals. Heat maps display concentrations of data points using a colored overlay that highlights the intensity or concentration of the visual's markers.
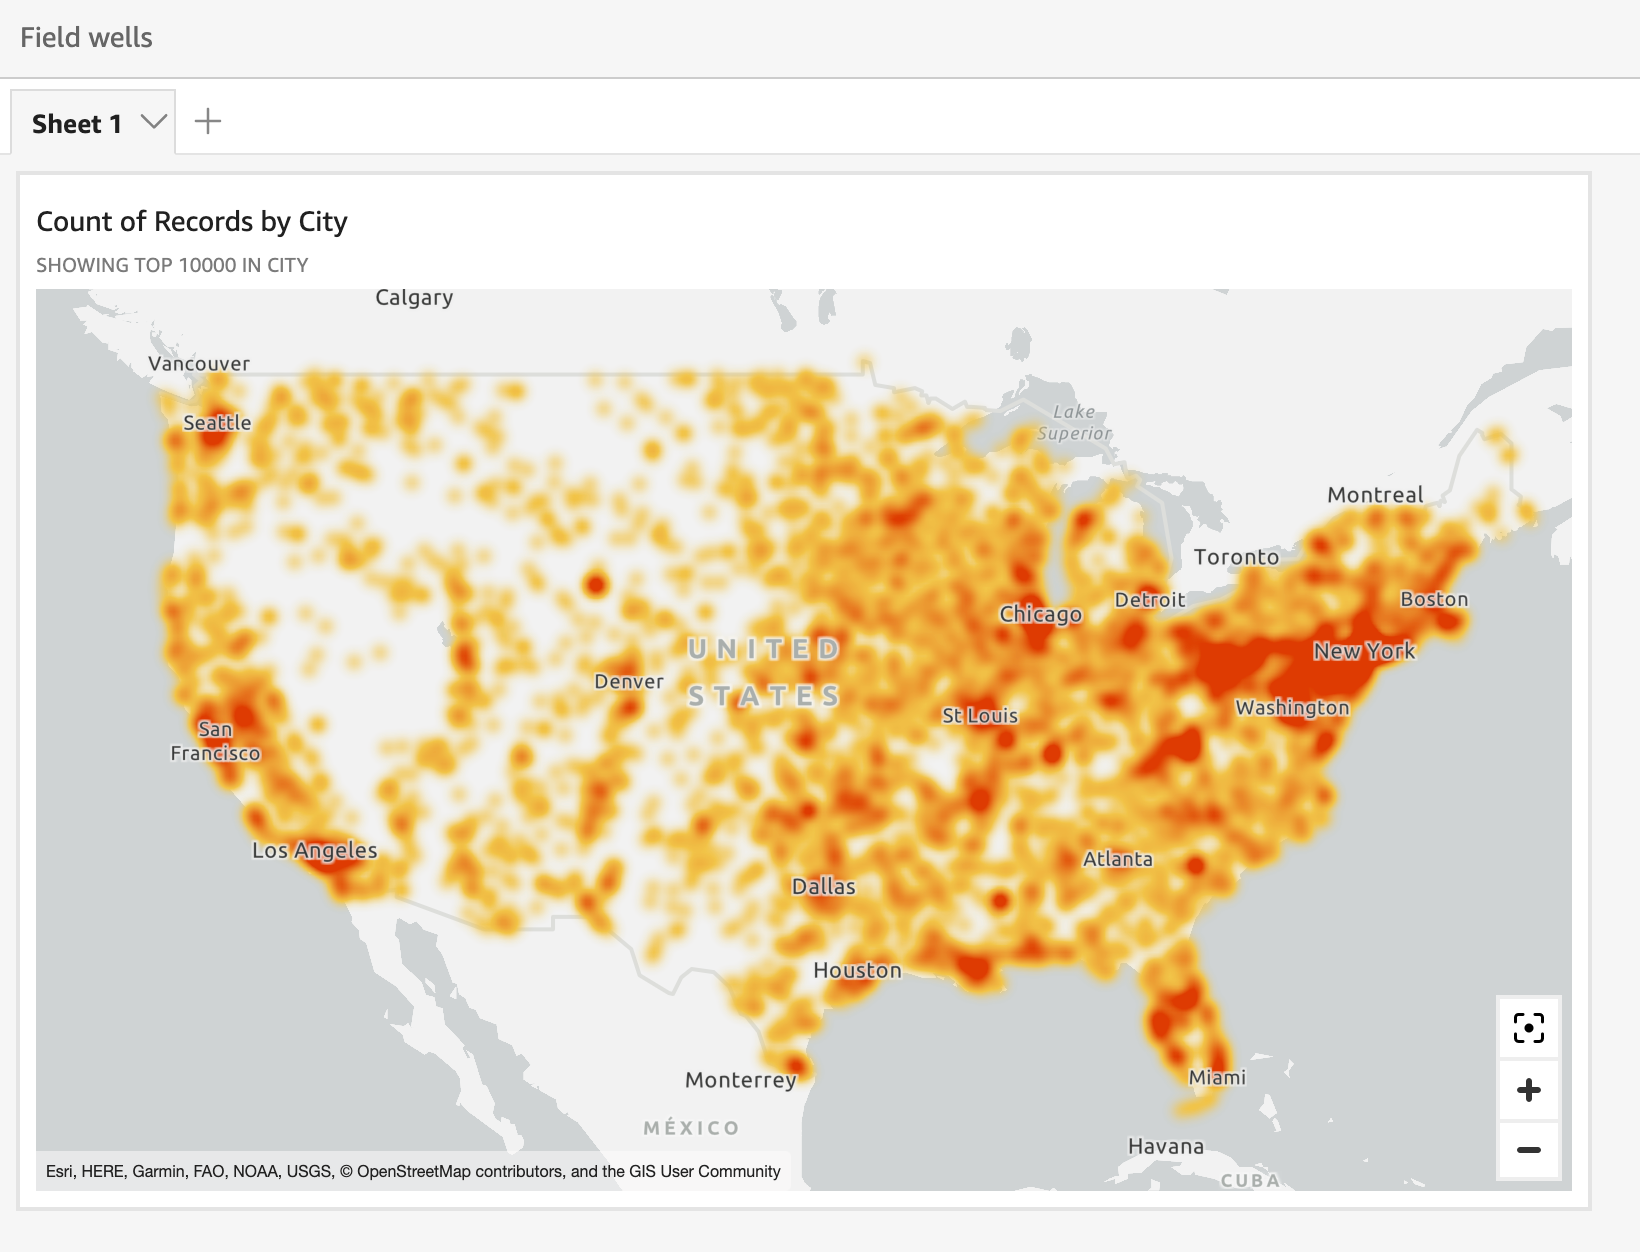
This is an example of marker clustering at work.
To turn a geospatial map into a heat map
  1. Open your analysis and choose the geospatial map that you want to format. When you select a visual, it displays with a highlight around it.

  2. To open the formatting pane, select Format visual from the on-visual menu.

  3. On the formatting pane at left, choose Points.

  4. Choose Heatmap.

  5. (Optional) For Heatmap gradient, choose a color that you want for the High density and Low density values.

PrivacySite termsCookie preferences
© 2025, Amazon Web Services, Inc. or its affiliates. All rights reserved.