Load and visualize output tensors using the TensorBoard application
You can conduct an online or offline analysis by loading collected output tensors from S3 buckets paired with training jobs during or after training.
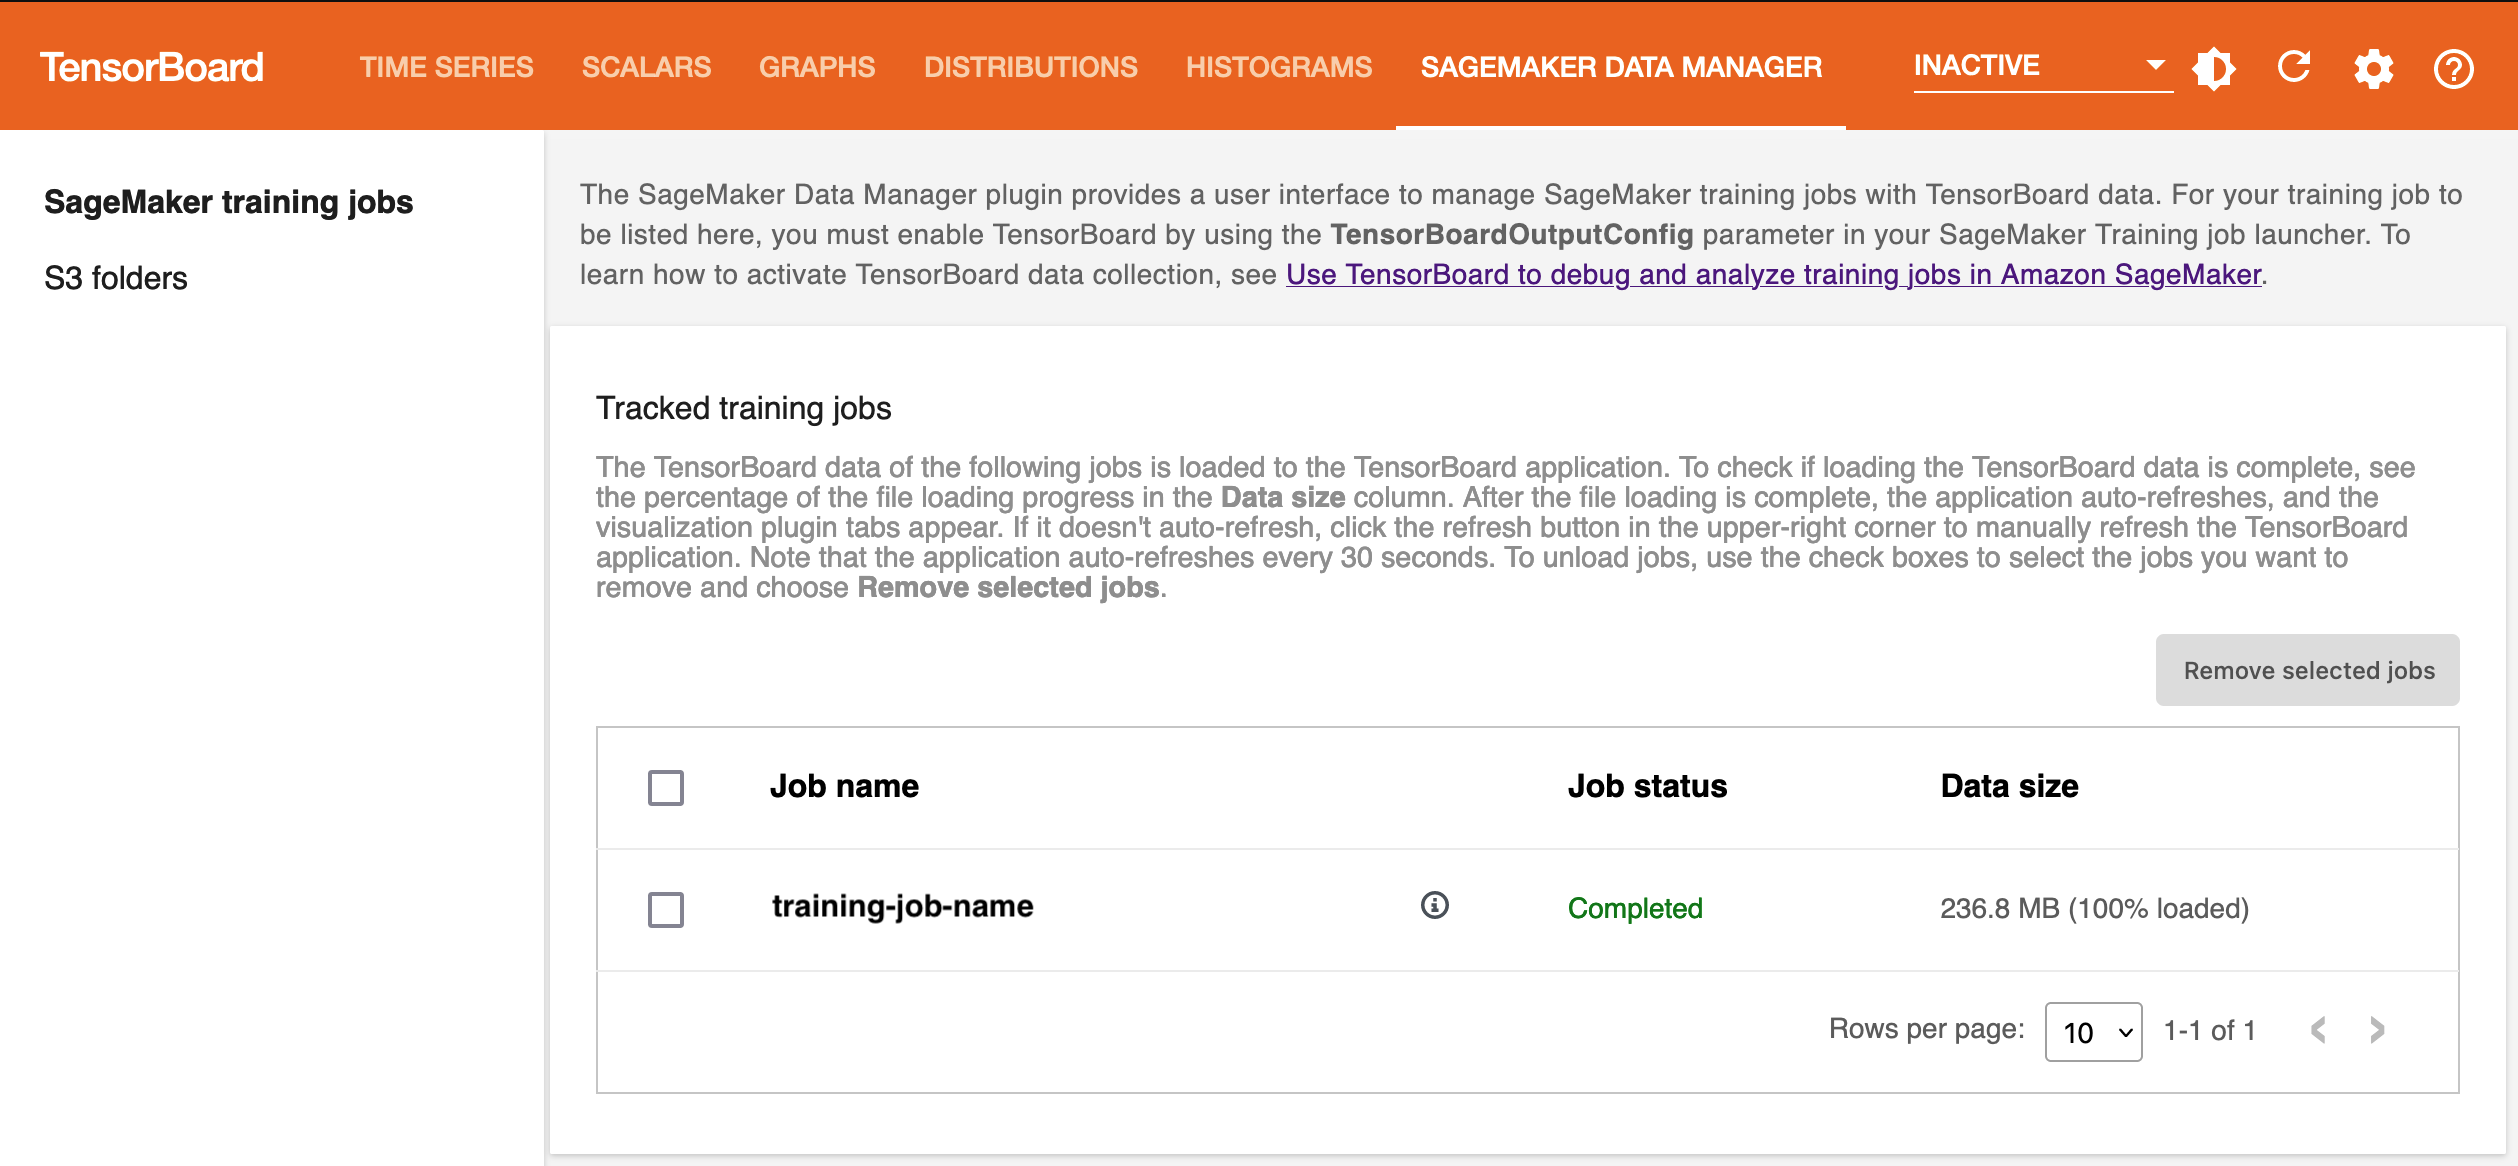
When you open the TensorBoard application, TensorBoard opens with the SageMaker AI Data Manager tab. The following screenshot shows the full view of the SageMaker AI Data Manager tab in the TensorBoard application.
Note
The visualization plugins might not appear when you first launch the TensorBoard application. After you select training jobs in the SageMaker AI Data Manager plugin, the TensorBoard application loads the TensorBoard data and populates the visualization plugins.
Note
The TensorBoard application automatically shuts down after 1 hour of inactivity. If you want to shut the application down when you are done using it, make sure to manually shut down TensorBoard to avoid paying for the instance hosting it. For instructions on deleting the application, see Delete unused TensorBoard applications.

In the SageMaker AI Data Manager tab, you can select any training job and load TensorBoard-compatible training output data from Amazon S3.
-
In the Search training jobs section, use the filters to narrow down the list of training jobs you want to find, load, and visualize.
-
In the List of training jobs section, use the check boxes to choose training jobs from which you want to pull data and visualize for debugging.
-
Choose Add selected jobs. The selected jobs should appear in the Tracked training jobs section, as shown in the following screenshot.
Note
The SageMaker AI Data Manager tab only shows training jobs configured
with the TensorBoardOutputConfig parameter. Make sure you have
configured the SageMaker AI ModelTrainer with this parameter. For more information, see Step 2: Create a SageMaker training ModelTrainer object with the TensorBoard output configuration.
Note
The visualization tabs might not appear if you are using SageMaker AI with TensorBoard for the first time or no data is loaded from a previous use. After adding training jobs and waiting for a few seconds, refresh the viewer by choosing the clockwise circular arrow on the upper-right corner. The visualization tabs should appear after the job data are successfully loaded. You can also set to auto-refresh using the Settings button next to the refresh button in the upper right corner.
Visualization of the output tensors in TensorBoard
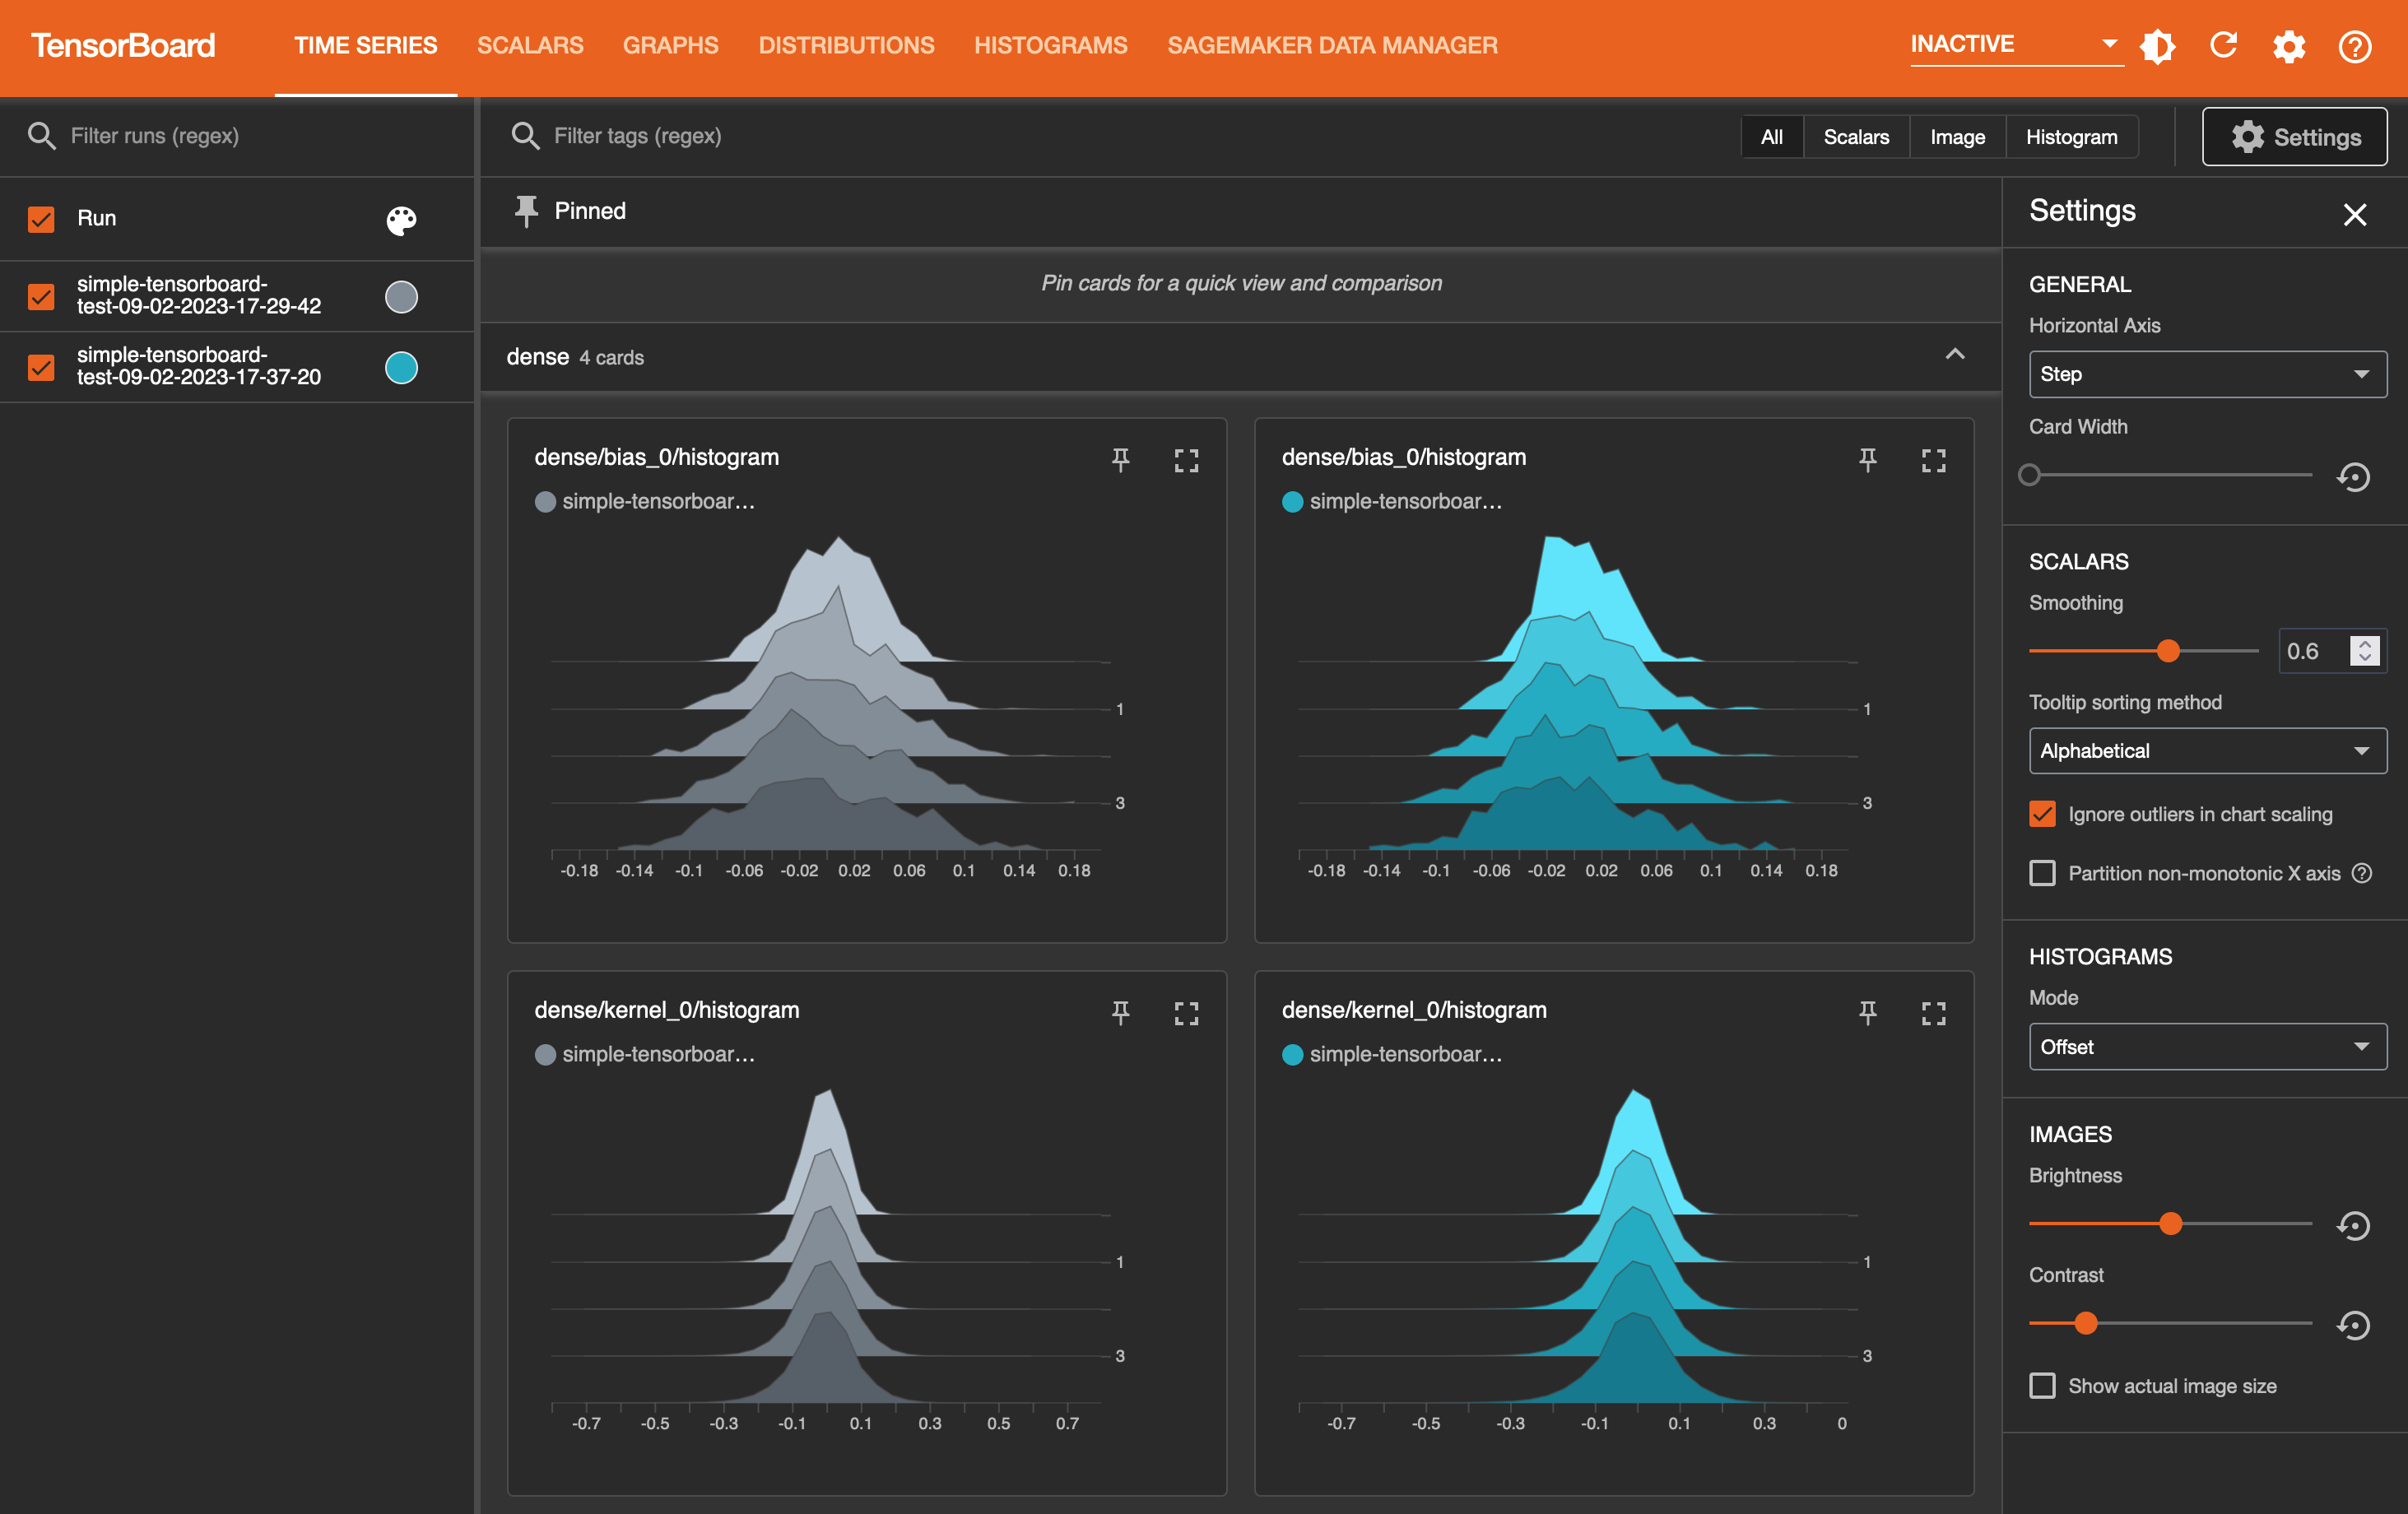
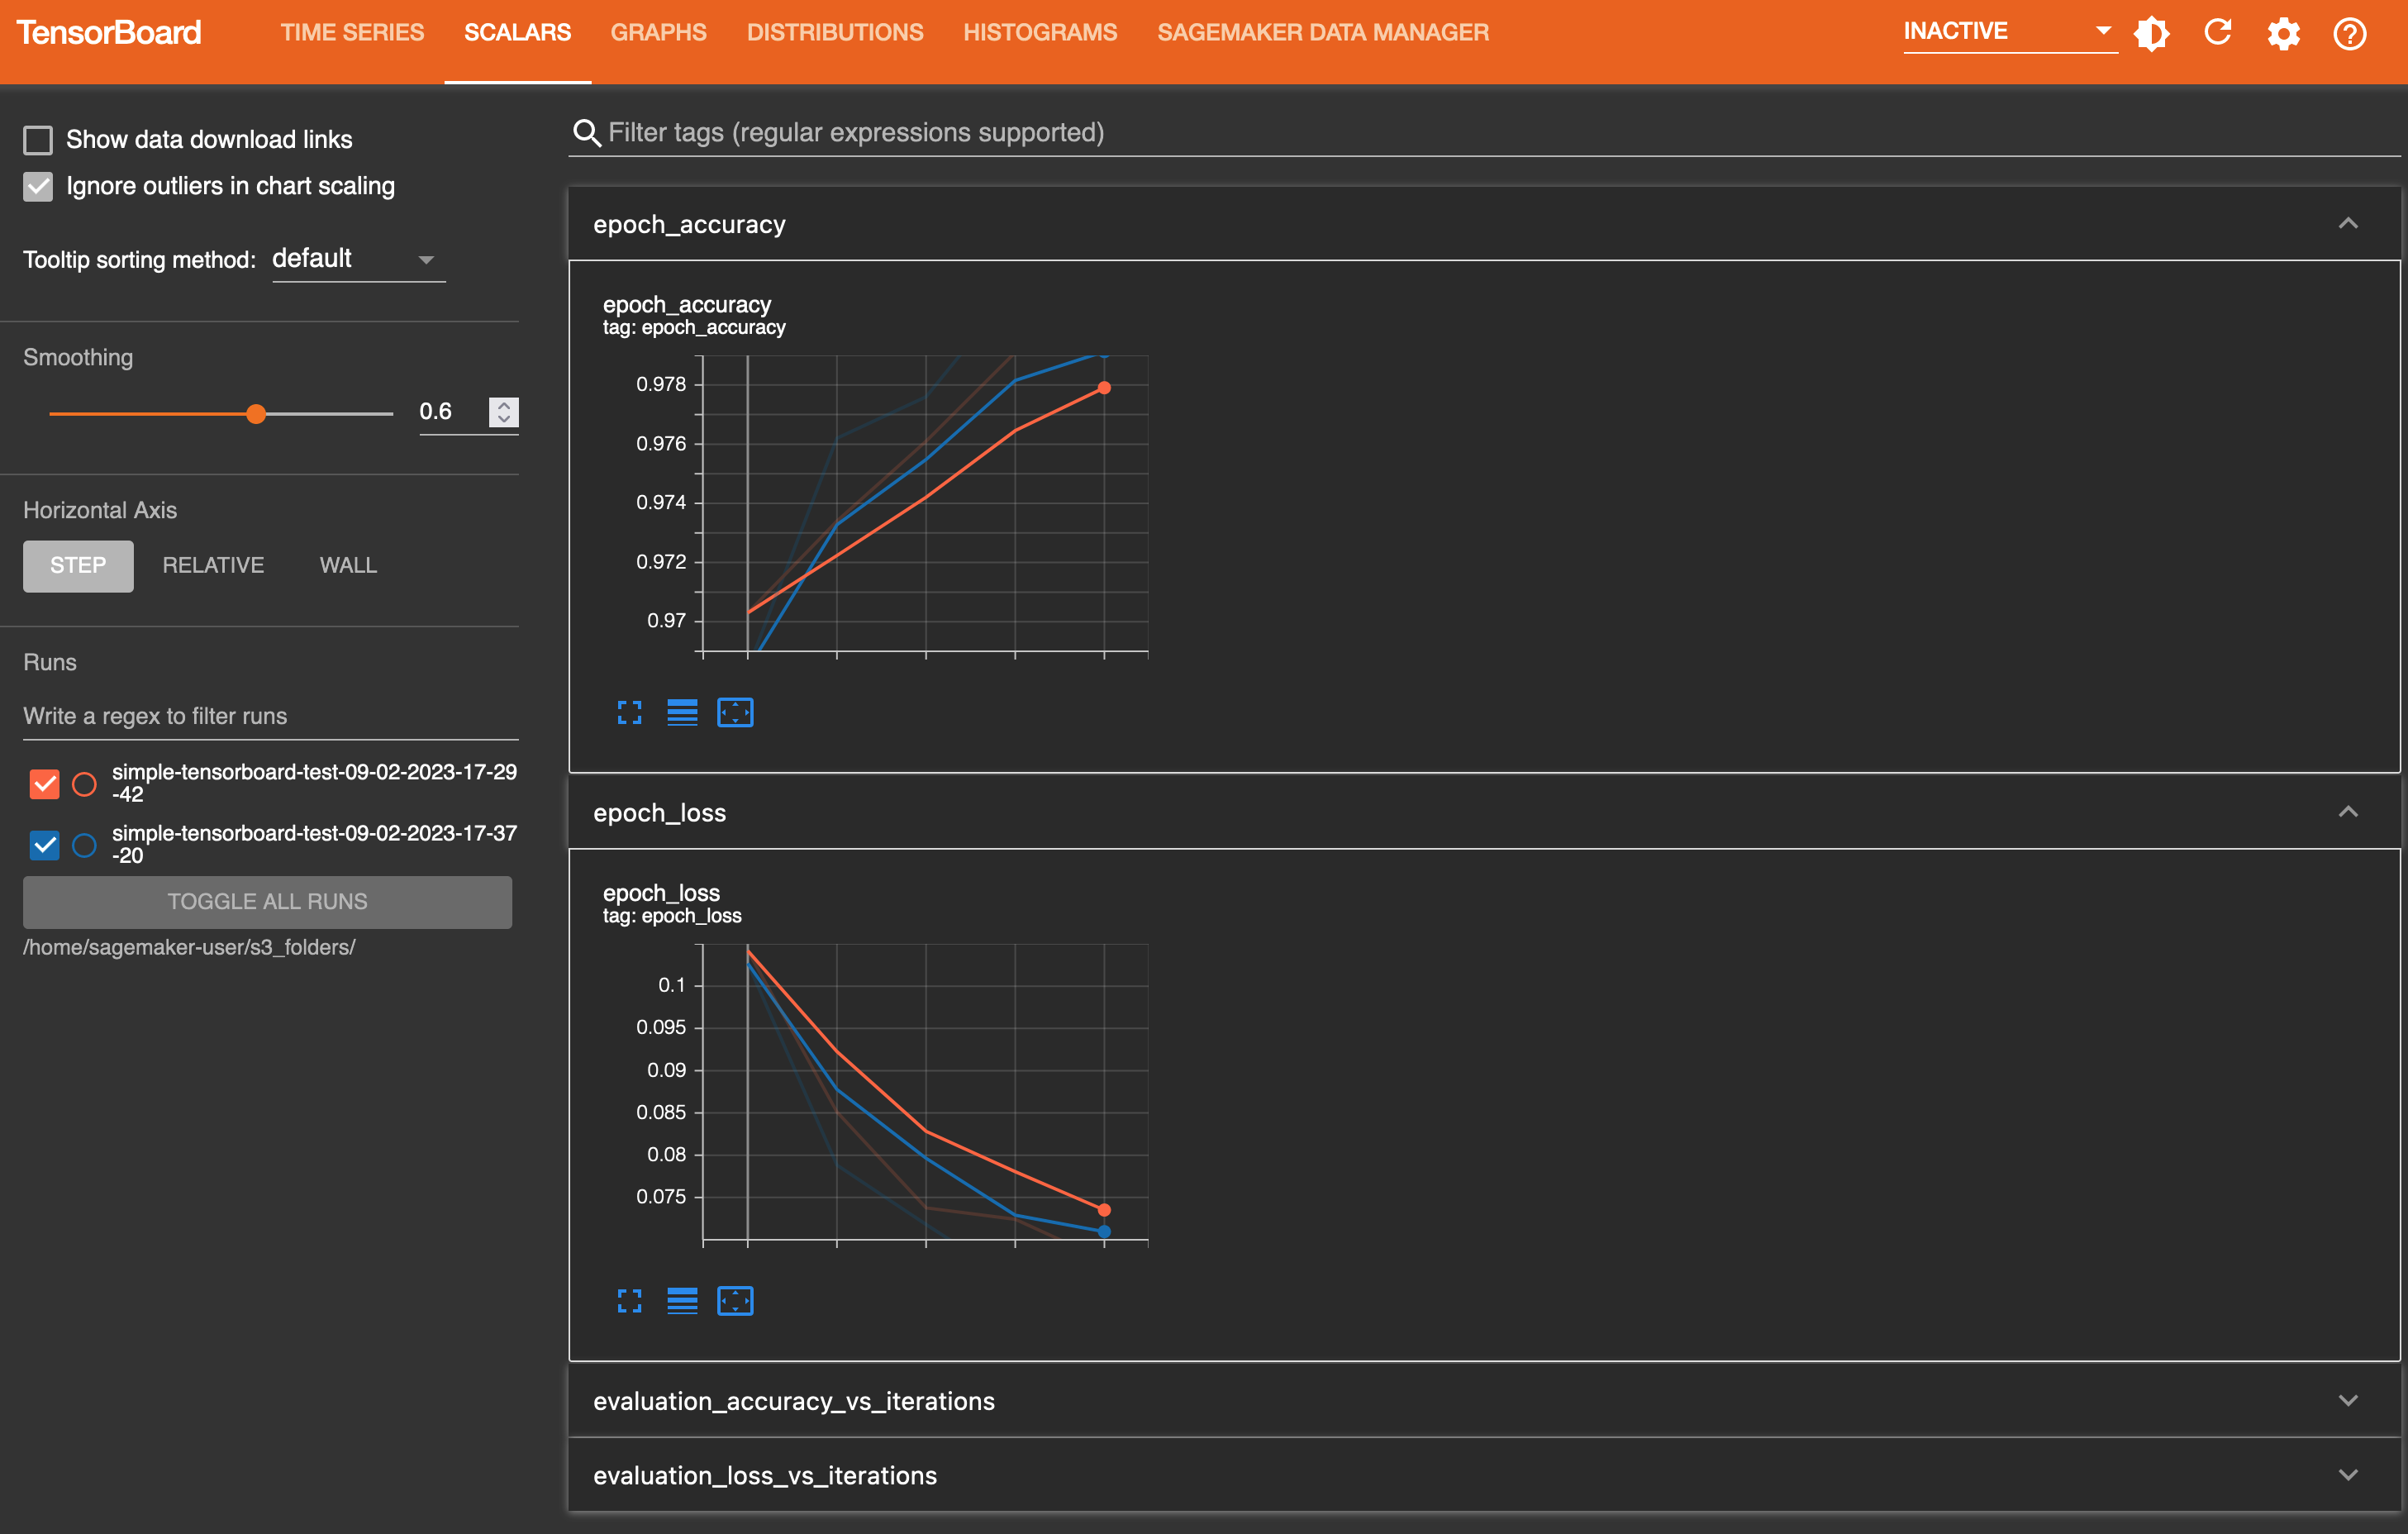
In the graphics tabs, you can find the list of the loaded training jobs in the left pane. You can also use the check boxes of the training jobs to show or hide visualizations. The TensorBoard dynamic plugins are activated dynamically depending on how you have set your training script to include summary writers and pass callbacks for tensor and scalar collection, and therefore the graphics tabs also appear dynamically. The following screenshots show example views of each tab with visualization of two training jobs that collected metrics for time series, scalar, graph, distribution, and histogram plugins.
The TIME SERIES tab view
The SCALARS tab view
The GRAPHS tab view

The DISTRIBUTIONS tab view

The HISTOGRAMS tab view

