Cluster observability
To gain visibility into the cluster resource utilization, set up Amazon CloudWatch Container Insights and Amazon Managed Grafana to extract metrics and visualize them on various dashboards.
Amazon CloudWatch Container Insights
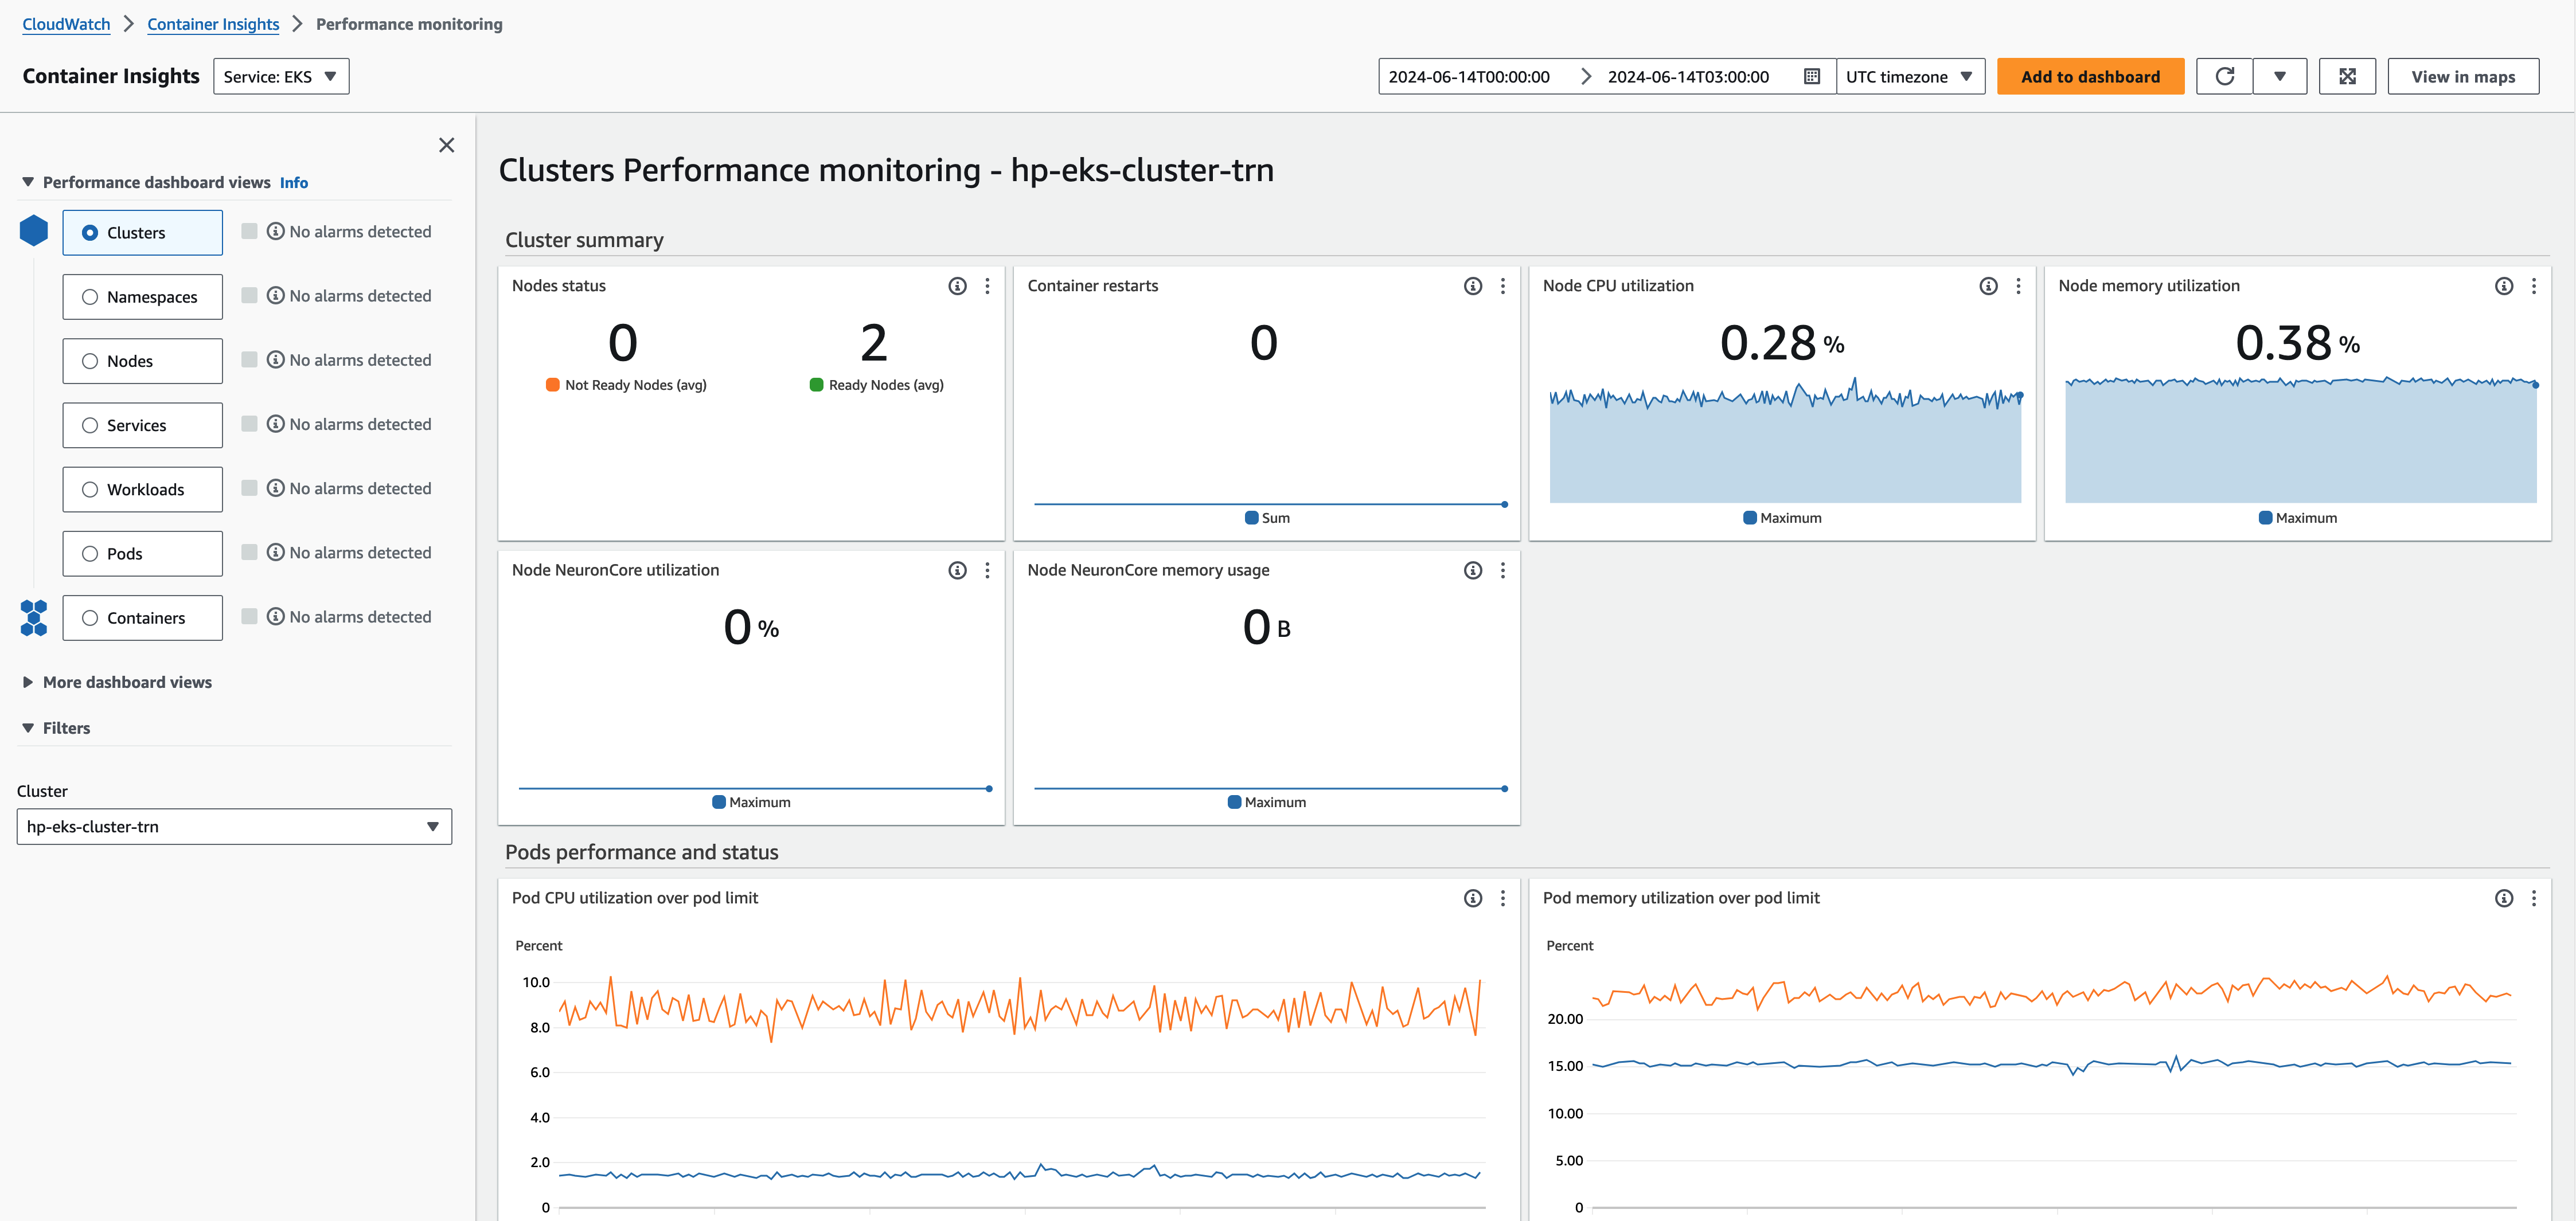
Use Amazon CloudWatch Container Insights to collect, aggregate, and summarize metrics and logs from the containerized applications and micro-services on the EKS cluster associated with a HyperPod cluster.
Amazon CloudWatch Insights collects metrics for compute resources, such as CPU, memory, disk, and network. Container Insights also provides diagnostic information, such as container restart failures, to help you isolate issues and resolve them quickly. You can also set CloudWatch alarms on metrics that Container Insights collects.
To find a complete list of metrics, see Amazon EKS and Kubernetes Container Insights metrics in the Amazon EKS User Guide.
Install CloudWatch Container Insights
Cluster admin users should set up CloudWatch Container Insights following the instructions at Install the CloudWatch agent by using the Amazon CloudWatch Observability EKS add-on or the Helm chart in the CloudWatch User Guide. For more information about Amazon EKS add-on, see also Install the Amazon CloudWatch Observability EKS add-on in the Amazon EKS User Guide.
After the installation has completed, verify that the CloudWatch Observability add-on is visible in the EKS cluster add-on tab. It might take about a couple of minutes until the dashboard loads.
Note
SageMaker HyperPod requires the CloudWatch Insight v2.0.1-eksbuild.1 or later.

Access CloudWatch container insights dashboard
Open the CloudWatch console at https://console.aws.amazon.com/cloudwatch/
. -
Choose Insights, and then choose Container Insights.
-
Select the EKS cluster set up with the HyperPod cluster you're using.
-
View the Pod/Cluster level metrics.

Access CloudWatch container insights logs
Open the CloudWatch console at https://console.aws.amazon.com/cloudwatch/
. -
Choose Logs, and then choose Log groups.
When you have the HyperPod clusters integrated with Amazon CloudWatch
Container Insights, you can access the relevant log groups in the following
format: /aws/containerinsights /<eks-cluster-name>/*. Within
this log group, you can find and explore various types of logs such as
Performance logs, Host logs, Application logs, and Data plane logs.
Set up an Amazon Managed Grafana workspace
You can integrate SageMaker HyperPod with Amazon Managed Grafana and Amazon Managed Service for Prometheus to gain comprehensive cluster observability and visualize in various Grafana dashboards: the Kubernetes cluster monitoring dashboard, the NVIDIA DCGM exporter dashboard, and the FSx for Lustre metrics dashboard, and the EFA metrics dashboard.