The AWS SDK for Java 1.x reached end-of-support on December 31, 2025. We recommend that you migrate to the AWS SDK for Java 2.x to continue receiving new features, availability improvements, and security updates.
Enabling Metrics for the AWS SDK for Java
The AWS SDK for Java can generate metrics for visualization and monitoring with
Amazon CloudWatch
-
your application’s performance when accessing AWS
-
the performance of your JVMs when used with AWS
-
runtime environment details such as heap memory, number of threads, and opened file descriptors
How to Enable Java SDK Metric Generation
You need to add the following Maven dependency to enable the SDK to send metrics to CloudWatch.
<dependencyManagement>
  <dependencies>
    <dependency>
      <groupId>com.amazonaws</groupId>
      <artifactId>aws-java-sdk-bom</artifactId>
      <version>1.12.490*</version>
      <type>pom</type>
      <scope>import</scope>
    </dependency>
  </dependencies>
</dependencyManagement>
<dependencies>
  <dependency>
    <groupId>com.amazonaws</groupId>
    <artifactId>aws-java-sdk-cloudwatchmetrics</artifactId>
    <scope>provided</scope>
  </dependency>
  <!-- Other SDK dependencies. -->
</dependencies>
*Replace the version number with the latest version of the SDK
available at Maven
Central
AWS SDK for Java metrics are disabled by default. To enable it for your local development environment, include a system property that points to your AWS security credential file when starting up the JVM. For example:
-Dcom.amazonaws.sdk.enableDefaultMetrics=credentialFile=/path/aws.properties
You need to specify the path to your credential file so that the SDK can upload the gathered datapoints to CloudWatch for later analysis.
Note
If you are accessing AWS from an Amazon EC2 instance using the Amazon EC2 instance metadata service, you don’t need to specify a credential file. In this case, you need only specify:
-Dcom.amazonaws.sdk.enableDefaultMetrics
All metrics captured by the AWS SDK for Java are under the namespace AWSSDK/Java, and are uploaded to the CloudWatch default region (us-east-1). To change the region, specify it by using the cloudwatchRegion attribute in the system property. For example, to set the CloudWatch region to us-east-1, use:
-Dcom.amazonaws.sdk.enableDefaultMetrics=credentialFile=/path/aws.properties,cloudwatchRegion={region_api_default}
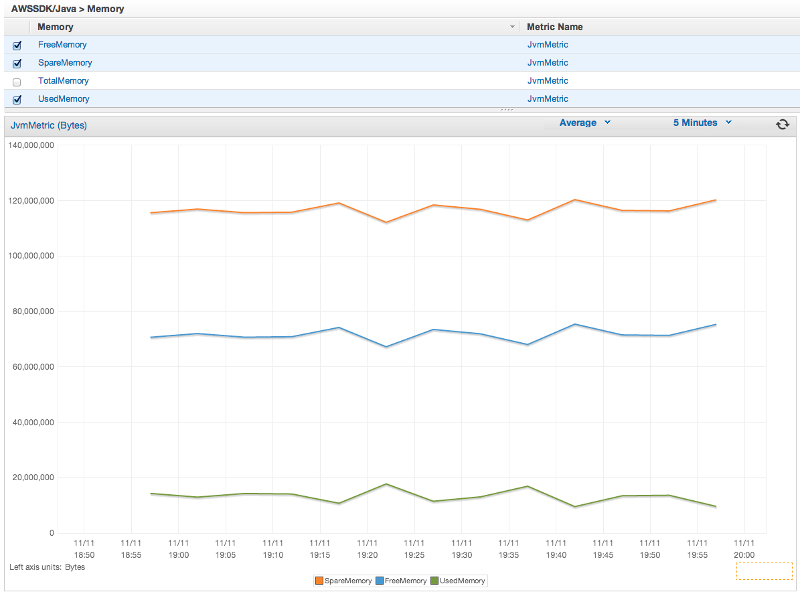
Once you enable the feature, every time there is a service request to AWS from the AWS SDK for Java, metric data points will be generated, queued for statistical summary, and uploaded asynchronously to CloudWatch about once every minute. Once metrics have been uploaded, you can visualize them using the AWS Management Console
Available Metric Types
The default set of metrics is divided into three major categories:
- AWS Request Metrics
-
-
Covers areas such as the latency of the HTTP request/response, number of requests, exceptions, and retries.

-
- AWS service Metrics
-
-
Include AWS service-specific data, such as the throughput and byte count for S3 uploads and downloads.

-
- Machine Metrics
-
-
Cover the runtime environment, including heap memory, number of threads, and open file descriptors.

If you want to exclude Machine Metrics, add
excludeMachineMetricsto the system property:-Dcom.amazonaws.sdk.enableDefaultMetrics=credentialFile=/path/aws.properties,excludeMachineMetrics
-
More Information
-
See the amazonaws/metrics package summary for a full list of the predefined core metric types.
-
Learn about working with CloudWatch using the AWS SDK for Java in CloudWatch Examples Using the AWS SDK for Java.
-
Learn more about performance tuning in Tuning the AWS SDK for Java to Improve Resiliency
blog post.