本文属于机器翻译版本。若本译文内容与英语原文存在差异,则一律以英文原文为准。
SageMaker 调试器交互式报告
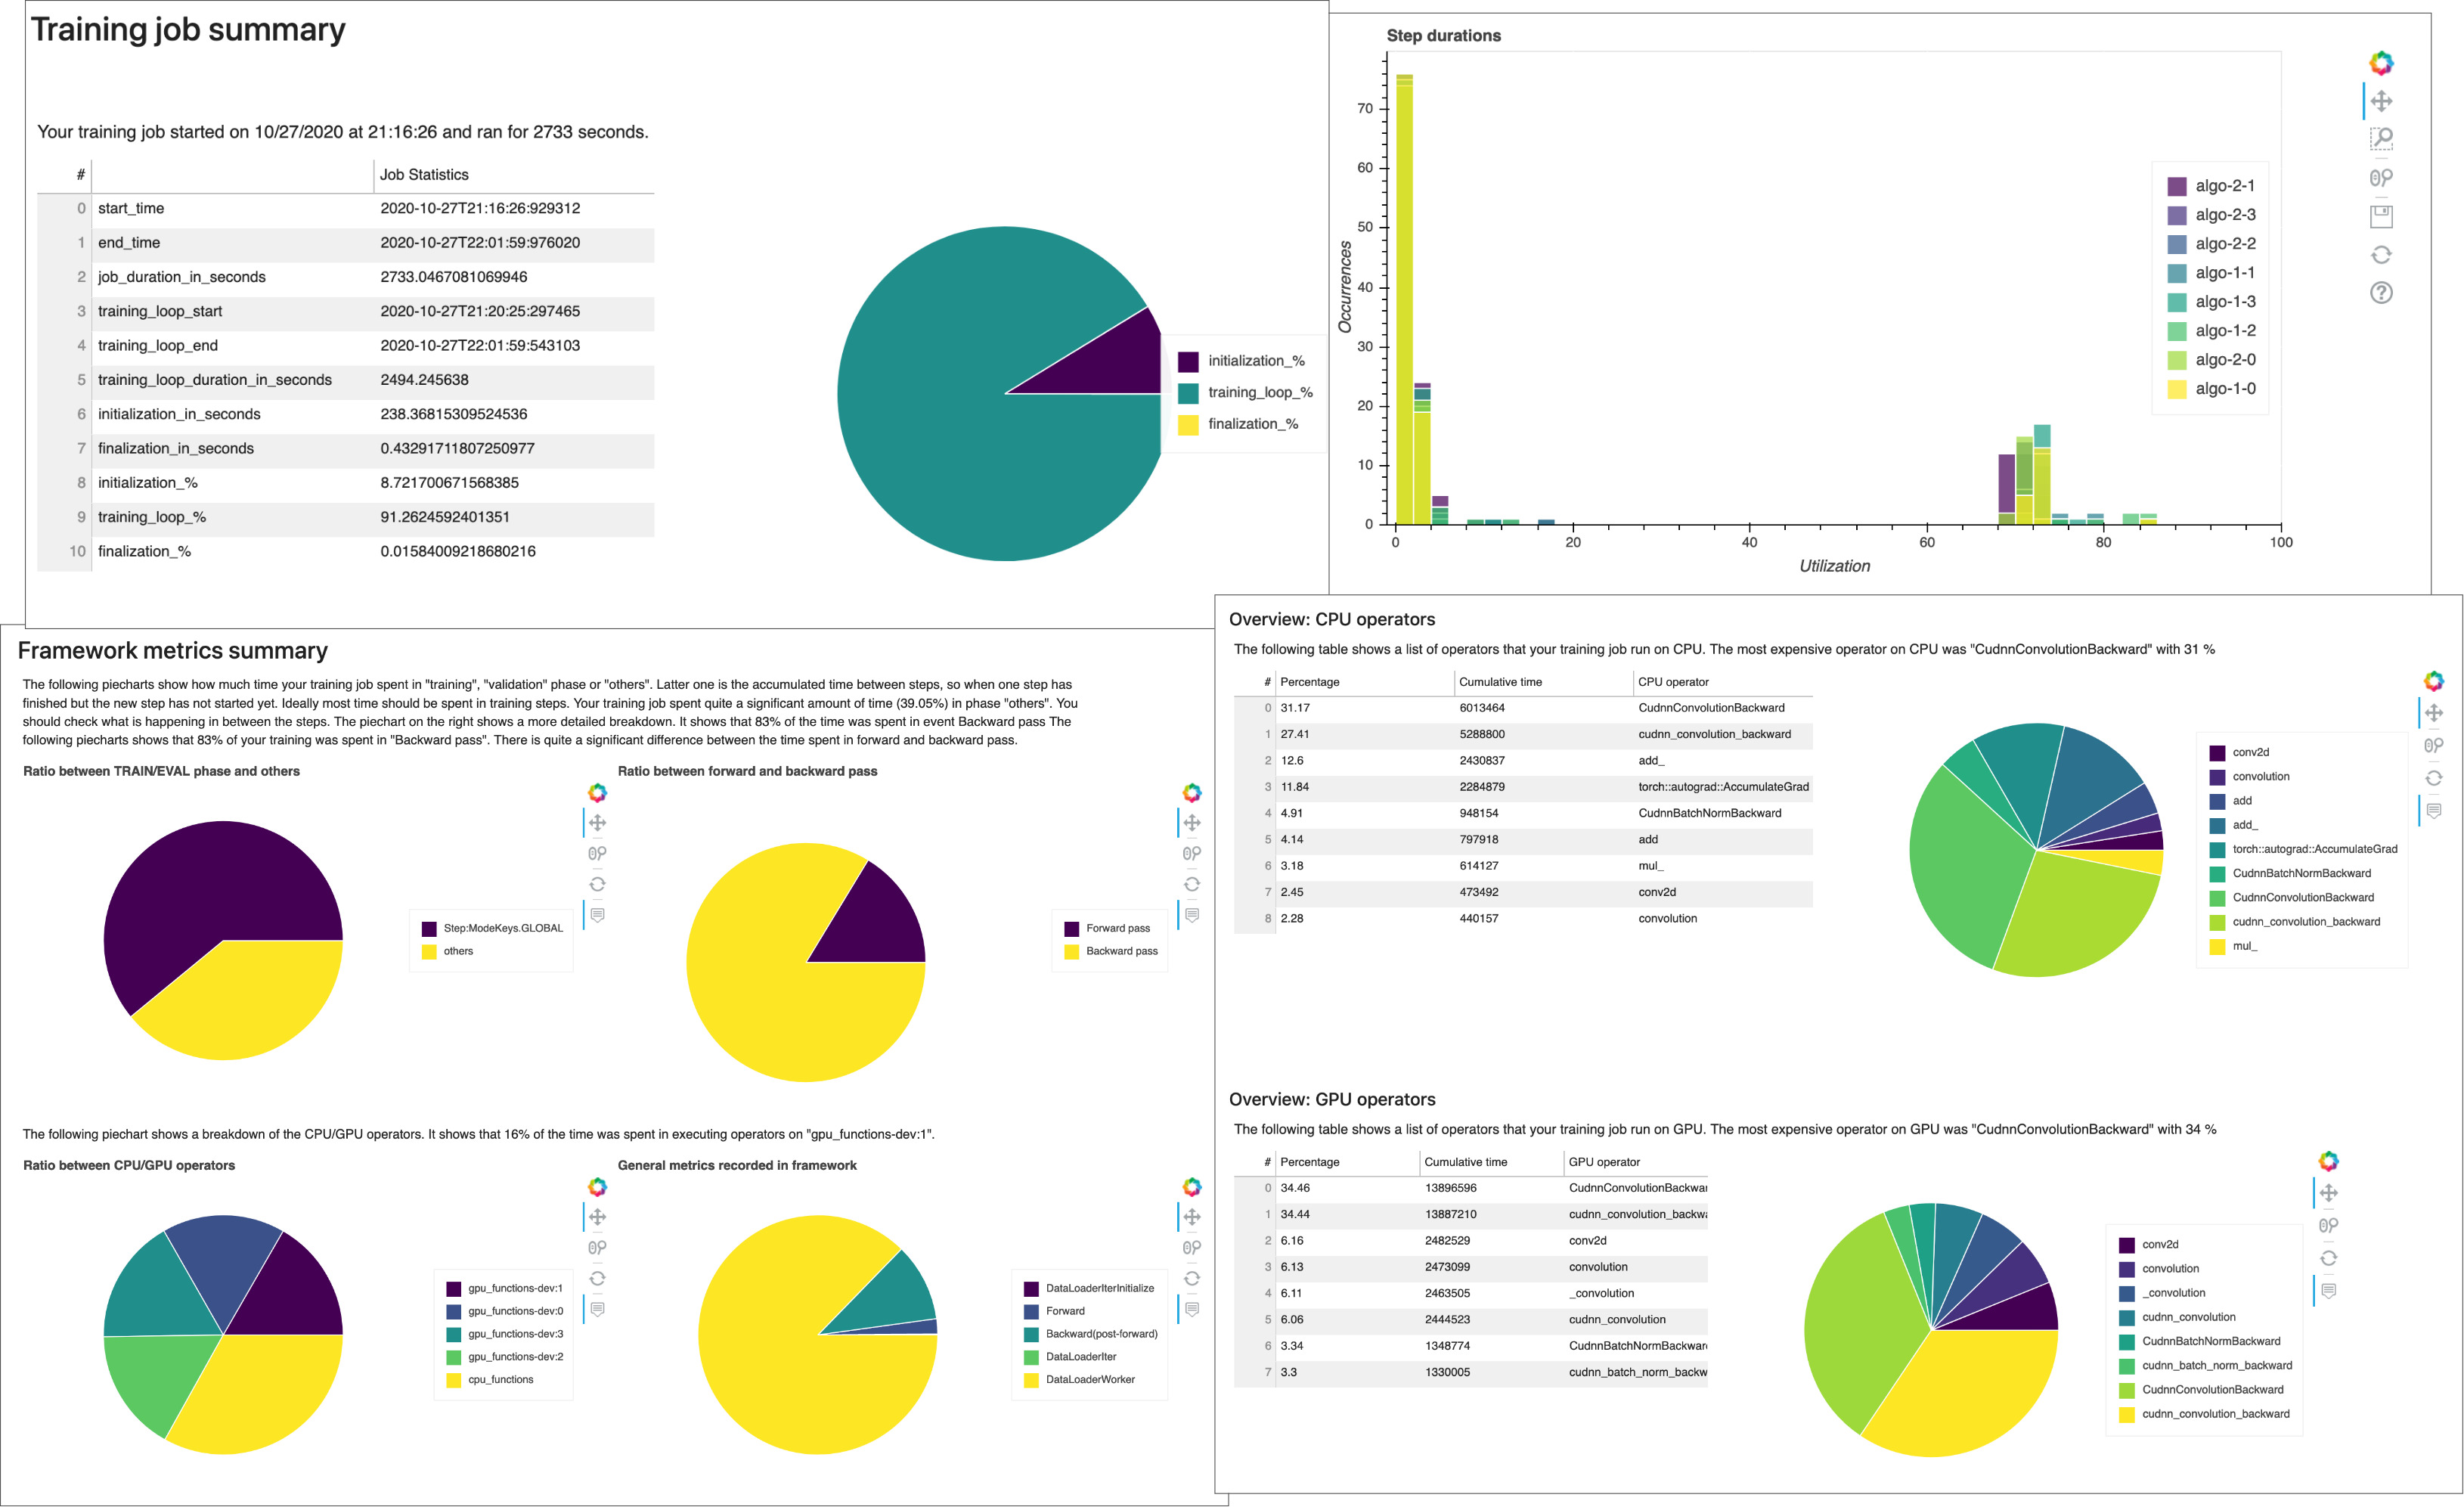
接收 Debugger 自动生成的分析报告。通过 Debugger 报告,您可以深入了解训练作业,并获得有关改善模型性能的建议。以下屏幕截图显示了 Debugger 分析报告拼贴图。要了解更多信息,请参阅SageMaker 调试器交互式报告。
注意
您可以在训练作业运行期间或作业完成后下载 Debugger 报告。在训练期间,Debugger 同时更新报告,反映当前规则的评估状态。只有在训练作业完成后,您才能下载完整的 Debugger 报告。
重要
报告中提供的图表和建议仅供参考,并不确保准确无误。您应负责对其中的信息进行单独评测。
对于任何 SageMaker 训练作业, SageMaker 调试器ProfilerReport规则都会调用所有监控和分析规则,并将规则分析汇总到一份综合报告中。按照本指南,使用 Amaz SageMaker on Python 软件开发工具包
重要
报告中提供的图表和建议仅供参考,并不确保准确无误。您应负责对其中的信息进行单独评测。
