本文属于机器翻译版本。若本译文内容与英语原文存在差异,则一律以英文原文为准。
用于计算ScriptProcessor归一化差值植被指数 (NDVI),使用以下方法 Sentinel-2 卫星数据
以下代码示例向您展示了如何使用 Studio Classic 笔记本中专门构建的地理空间图像计算特定地理区域的归一化差异植被指数,以及如何使用 Python 在 Ama SageMaker zon Proc ScriptProcessor
此演示还使用了使用地理空间内核和实例类型的 Amazon SageMaker Studio Classic 笔记本实例。要了解如何创建 Studio Classic 地理空间笔记本实例,请参阅使用地理空间图像创建 Amazon SageMaker Studio Classic 笔记本。
您可以在自己的笔记本实例中通过复制和粘贴以下代码片段来完成此演示:
查询 Sentinel-2 使用栅格数据采集 SearchRasterDataCollection
使用 search_raster_data_collection 可以查询支持的栅格数据集合。此示例使用从中提取的数据 Sentinel-2 卫星。指定的感兴趣区域 (AreaOfInterest) 是爱荷华州北部的农村地区,时间范围 (TimeRangeFilter) 是 2022 年 1 月 1 日至 2022 年 12 月 30 日。要查看 AWS 区域 中可用的栅格数据集合,请使用 list_raster_data_collections。要查看使用它的代码示例API,请参阅ListRasterDataCollections《Amazon SageMaker 开发者指南》。
在以下代码示例中,您将使用与ARN关联的 Sentinel-2 栅格数据收集,arn:aws:sagemaker-geospatial:us-west-2:378778860802:raster-data-collection/public/nmqj48dcu3g7ayw8。
search_raster_data_collectionAPI请求需要两个参数:
-
您需要指定与要查询的栅格数据集合相对应的
Arn参数。 -
您还需要指定一个
RasterDataCollectionQuery参数,该参数接收 Python 字典。
下面的代码示例包含保存到 search_rdc_query 变量的 RasterDataCollectionQuery 参数所需的必要键值对。
search_rdc_query = {
    "AreaOfInterest": {
        "AreaOfInterestGeometry": {
            "PolygonGeometry": {
                "Coordinates": [[
                    [
              -94.50938680498298,
              43.22487436936203
            ],
            [
              -94.50938680498298,
              42.843474642037194
            ],
            [
              -93.86520004156142,
              42.843474642037194
            ],
            [
              -93.86520004156142,
              43.22487436936203
            ],
            [
              -94.50938680498298,
              43.22487436936203
            ]
               ]]
            }
        }
    },
    "TimeRangeFilter": {"StartTime": "2022-01-01T00:00:00Z", "EndTime": "2022-12-30T23:59:59Z"}
}
要提出search_raster_data_collection请求,您必须ARN指定 Sentinel-2 栅格数据收集:arn:aws:sagemaker-geospatial:us-west-2:378778860802:raster-data-collection/public/nmqj48dcu3g7ayw8。还必须传入前面定义的 Python 字典,该字典指定查询参数。
## Creates a SageMaker Geospatial client instance
sm_geo_client= session.create_client(service_name="sagemaker-geospatial")

search_rdc_response1 = sm_geo_client.search_raster_data_collection(
    Arn='arn:aws:sagemaker-geospatial:us-west-2:378778860802:raster-data-collection/public/nmqj48dcu3g7ayw8',
    RasterDataCollectionQuery=search_rdc_query
)
API无法对结果进行分页。要收集 search_raster_data_collection 操作返回的所有卫星图像,可以实现 while 循环。这将在API响应NextToken中检查:
## Holds the list of API responses from search_raster_data_collection
items_list = []
while search_rdc_response1.get('NextToken') and search_rdc_response1['NextToken'] != None:
    items_list.extend(search_rdc_response1['Items'])

    search_rdc_response1 = sm_geo_client.search_raster_data_collection(
    	Arn='arn:aws:sagemaker-geospatial:us-west-2:378778860802:raster-data-collection/public/nmqj48dcu3g7ayw8',
        RasterDataCollectionQuery=search_rdc_query,
        NextToken=search_rdc_response1['NextToken']
    )
API响应返回与特定图像波段对应的Assets密钥URLs下方的列表。以下是响应的截断版本。API为了清晰起见,删除了一些图像波段。
{
	'Assets': {
        'aot': {
            'Href': 'https://sentinel-cogs.s3.us-west-2.amazonaws.com/sentinel-s2-l2a-cogs/15/T/UH/2022/12/S2A_15TUH_20221230_0_L2A/AOT.tif'
        },
        'blue': {
            'Href': 'https://sentinel-cogs.s3.us-west-2.amazonaws.com/sentinel-s2-l2a-cogs/15/T/UH/2022/12/S2A_15TUH_20221230_0_L2A/B02.tif'
        },
        'swir22-jp2': {
            'Href': 's3://sentinel-s2-l2a/tiles/15/T/UH/2022/12/30/0/B12.jp2'
        },
        'visual-jp2': {
            'Href': 's3://sentinel-s2-l2a/tiles/15/T/UH/2022/12/30/0/TCI.jp2'
        },
        'wvp-jp2': {
            'Href': 's3://sentinel-s2-l2a/tiles/15/T/UH/2022/12/30/0/WVP.jp2'
        }
    },
    'DateTime': datetime.datetime(2022, 12, 30, 17, 21, 52, 469000, tzinfo = tzlocal()),
    'Geometry': {
        'Coordinates': [
            [
                [-95.46676936182894, 43.32623760511659],
                [-94.11293433656887, 43.347431265475954],
                [-94.09532154452742, 42.35884880571144],
                [-95.42776890002203, 42.3383710796791],
                [-95.46676936182894, 43.32623760511659]
            ]
        ],
        'Type': 'Polygon'
    },
    'Id': 'S2A_15TUH_20221230_0_L2A',
    'Properties': {
        'EoCloudCover': 62.384969,
        'Platform': 'sentinel-2a'
    }
}
在下一节中,您将使用API响应中的'Id'密钥创建清单文件。
使用search_raster_data_collectionAPI响应中的Id密钥创建输入清单文件
运行处理作业时,必须指定来自 Amazon S3 的数据输入。输入数据类型可以是清单文件,然后清单文件指向各个数据文件。您也可以为要处理的每个文件添加前缀。以下代码示例定义了将在其中生成清单文件的文件夹。
使用 SDK Python (Boto3) 获取默认存储桶以及与 Studio Classic 笔记本实例关联的执行角色:ARN
sm_session = sagemaker.session.Session() s3 = boto3.resource('s3') # Gets the default excution role associated with the notebook execution_role_arn = sagemaker.get_execution_role() # Gets the default bucket associated with the notebook s3_bucket = sm_session.default_bucket() # Can be replaced with any name s3_folder ="script-processor-input-manifest"
接下来,创建一个清单文件。当你稍后在步骤 4 中运行处理作业时,它将保存你想要处理的卫星图像。URLs
# Format of a manifest file
manifest_prefix = {}
manifest_prefix['prefix'] = 's3://' + s3_bucket + '/' + s3_folder + '/'
manifest = [manifest_prefix]

print(manifest)
以下代码示例返回将在URI其中创建清单文件的 S3。
[{'prefix': 's3://sagemaker-us-west-2-111122223333/script-processor-input-manifest/'}]
运行处理作业时不需要使用 search_raster_data_collection 响应中的所有响应元素。
以下代码片段删除了不必要的元素 'Properties'、'Geometry' 和 'DateTime'。'Id' 键值对 'Id': 'S2A_15TUH_20221230_0_L2A' 包含年份和月份。以下代码示例解析该数据以在中创建新密钥 Python 字典dict_month_items。这些值是从 SearchRasterDataCollection 查询返回的资产。
# For each response get the month and year, and then remove the metadata not related to the satelite images.
dict_month_items = {}
for item in items_list:
    # Example ID being split: 'S2A_15TUH_20221230_0_L2A'
    yyyymm = item['Id'].split("_")[2][:6]
    if yyyymm not in dict_month_items:
        dict_month_items[yyyymm] = []

    # Removes uneeded metadata elements for this demo
    item.pop('Properties', None)
    item.pop('Geometry', None)
    item.pop('DateTime', None)

    # Appends the response from search_raster_data_collection to newly created key above
    dict_month_items[yyyymm].append(item)
此代码示例使用以下.upload_file()dict_month_items到 Amazon S3:
## key_ is the yyyymm timestamp formatted above
## value_ is the reference to all the satellite images collected via our searchRDC query
for key_, value_ in dict_month_items.items():
    filename = f'manifest_{key_}.json'
    with open(filename, 'w') as fp:
        json.dump(value_, fp)
    s3.meta.client.upload_file(filename, s3_bucket, s3_folder + '/' + filename)
    manifest.append(filename)
    os.remove(filename)
此代码示例将上传指向上传到 Amazon S3 的所有其他清单的父 manifest.json 文件。它还会保存局部变量 s3_manifest_uri 的路径。在步骤 4 中运行处理作业时,您将再次使用该变量来指定输入数据的来源。
with open('manifest.json', 'w') as fp:
    json.dump(manifest, fp)
s3.meta.client.upload_file('manifest.json', s3_bucket, s3_folder + '/' + 'manifest.json')
os.remove('manifest.json')

s3_manifest_uri = f's3://{s3_bucket}/{s3_folder}/manifest.json'
既然已经创建并上传了输入清单文件,那么就可以编写一个脚本,在处理作业中处理数据。它处理来自卫星图像的数据,进行计算NDVI,然后将结果返回到不同的 Amazon S3 位置。
编写一个脚本来计算 NDVI
Amazon SageMaker Studio Classic 支持使用%%writefile细胞魔法命令。使用此命令运行单元格后,其内容将保存到本地 Studio Classic 目录中。这是专门用于计算的代码NDVI。不过,当您为处理作业编写自己的脚本时,以下内容可能很有用:
-
在处理作业容器中,容器内的本地路径必须以
/opt/ml/processing/开头。在本例中,input_data_path = '/opt/ml/processing/input_data/'和processed_data_path = '/opt/ml/processing/output_data/'是以这种方式指定的。 -
使用 Amazon P SageMaker ro cessing,处理任务运行的脚本可以将处理后的数据直接上传到 Amazon S3。为此,请确保与
ScriptProcessor实例关联的执行角色具备访问 S3 存储桶的必要条件。您还可以在运行处理作业时指定输出参数。要了解更多信息,请参阅 Amaz SageMaker on Python 中的.run()API操作SDK。在此代码示例中,数据处理结果直接上传到 Amazon S3。 -
要管理您的处理任务所EBScontainer附的 Amazon 的大小,请使用
volume_size_in_gb参数。容器的默认大小为 30 GB。您也可以选择使用 Python 库垃圾收集器来管理您的 Amazon EBS 容器中的存储。 以下代码示例将数组加载到处理作业容器中。当数组累积并填满内存时,处理作业将崩溃。为防止出现这种崩溃,下面的示例包含了从处理作业容器中删除数组的命令。
%%writefile compute_ndvi.py

import os
import pickle
import sys
import subprocess
import json
import rioxarray

if __name__ == "__main__":
    print("Starting processing")

    input_data_path = '/opt/ml/processing/input_data/'
    input_files = []

    for current_path, sub_dirs, files in os.walk(input_data_path):
        for file in files:
            if file.endswith(".json"):
                input_files.append(os.path.join(current_path, file))

    print("Received {} input_files: {}".format(len(input_files), input_files))

    items = []
    for input_file in input_files:
        full_file_path = os.path.join(input_data_path, input_file)
        print(full_file_path)
        with open(full_file_path, 'r') as f:
            items.append(json.load(f))

    items = [item for sub_items in items for item in sub_items]

    for item in items:
        red_uri = item["Assets"]["red"]["Href"]
        nir_uri = item["Assets"]["nir"]["Href"]

        red = rioxarray.open_rasterio(red_uri, masked=True)
        nir = rioxarray.open_rasterio(nir_uri, masked=True)

        ndvi = (nir - red)/ (nir + red)

        file_name = 'ndvi_' + item["Id"] + '.tif'
        output_path = '/opt/ml/processing/output_data'
        output_file_path = f"{output_path}/{file_name}"

        ndvi.rio.to_raster(output_file_path)
        print("Written output:", output_file_path)
现在,您有了可以计算的脚本NDVI。接下来,您可以创建的实例 ScriptProcessor 并运行您的处理作业。
创建 ScriptProcessor 类的实例
此演示使用可通过 Amaz SageMaker on Python 提供的ScriptProcessor.run() 方法启动处理作业。
from sagemaker.processing import ScriptProcessor, ProcessingInput, ProcessingOutput image_uri ='081189585635.dkr.ecr.us-west-2.amazonaws.com/sagemaker-geospatial-v1-0:latest'processor = ScriptProcessor( command=['python3'], image_uri=image_uri, role=execution_role_arn, instance_count=4, instance_type='ml.m5.4xlarge', sagemaker_session=sm_session ) print('Starting processing job.')
当您启动处理作业时,需要指定一个 ProcessingInput
-
您在步骤 2 中创建的清单文件的路径
s3_manifest_uri。这是容器的输入数据的来源。 -
输入数据保存在容器中的路径。这必须与您在脚本中指定的路径相匹配。
-
使用
s3_data_type参数指定输入为"ManifestFile"。
s3_output_prefix_url = f"s3://{s3_bucket}/{s3_folder}/output"

processor.run(
    code='compute_ndvi.py',
    inputs=[
        ProcessingInput(
            source=s3_manifest_uri,
            destination='/opt/ml/processing/input_data/',
            s3_data_type="ManifestFile",
            s3_data_distribution_type="ShardedByS3Key"
        ),
    ],
    outputs=[
        ProcessingOutput(
            source='/opt/ml/processing/output_data/',
            destination=s3_output_prefix_url,
            s3_upload_mode="Continuous"
        )
    ]
)
以下代码示例使用 .describe() 方法
preprocessing_job_descriptor = processor.jobs[-1].describe()
s3_output_uri = preprocessing_job_descriptor["ProcessingOutputConfig"]["Outputs"][0]["S3Output"]["S3Uri"]
print(s3_output_uri)
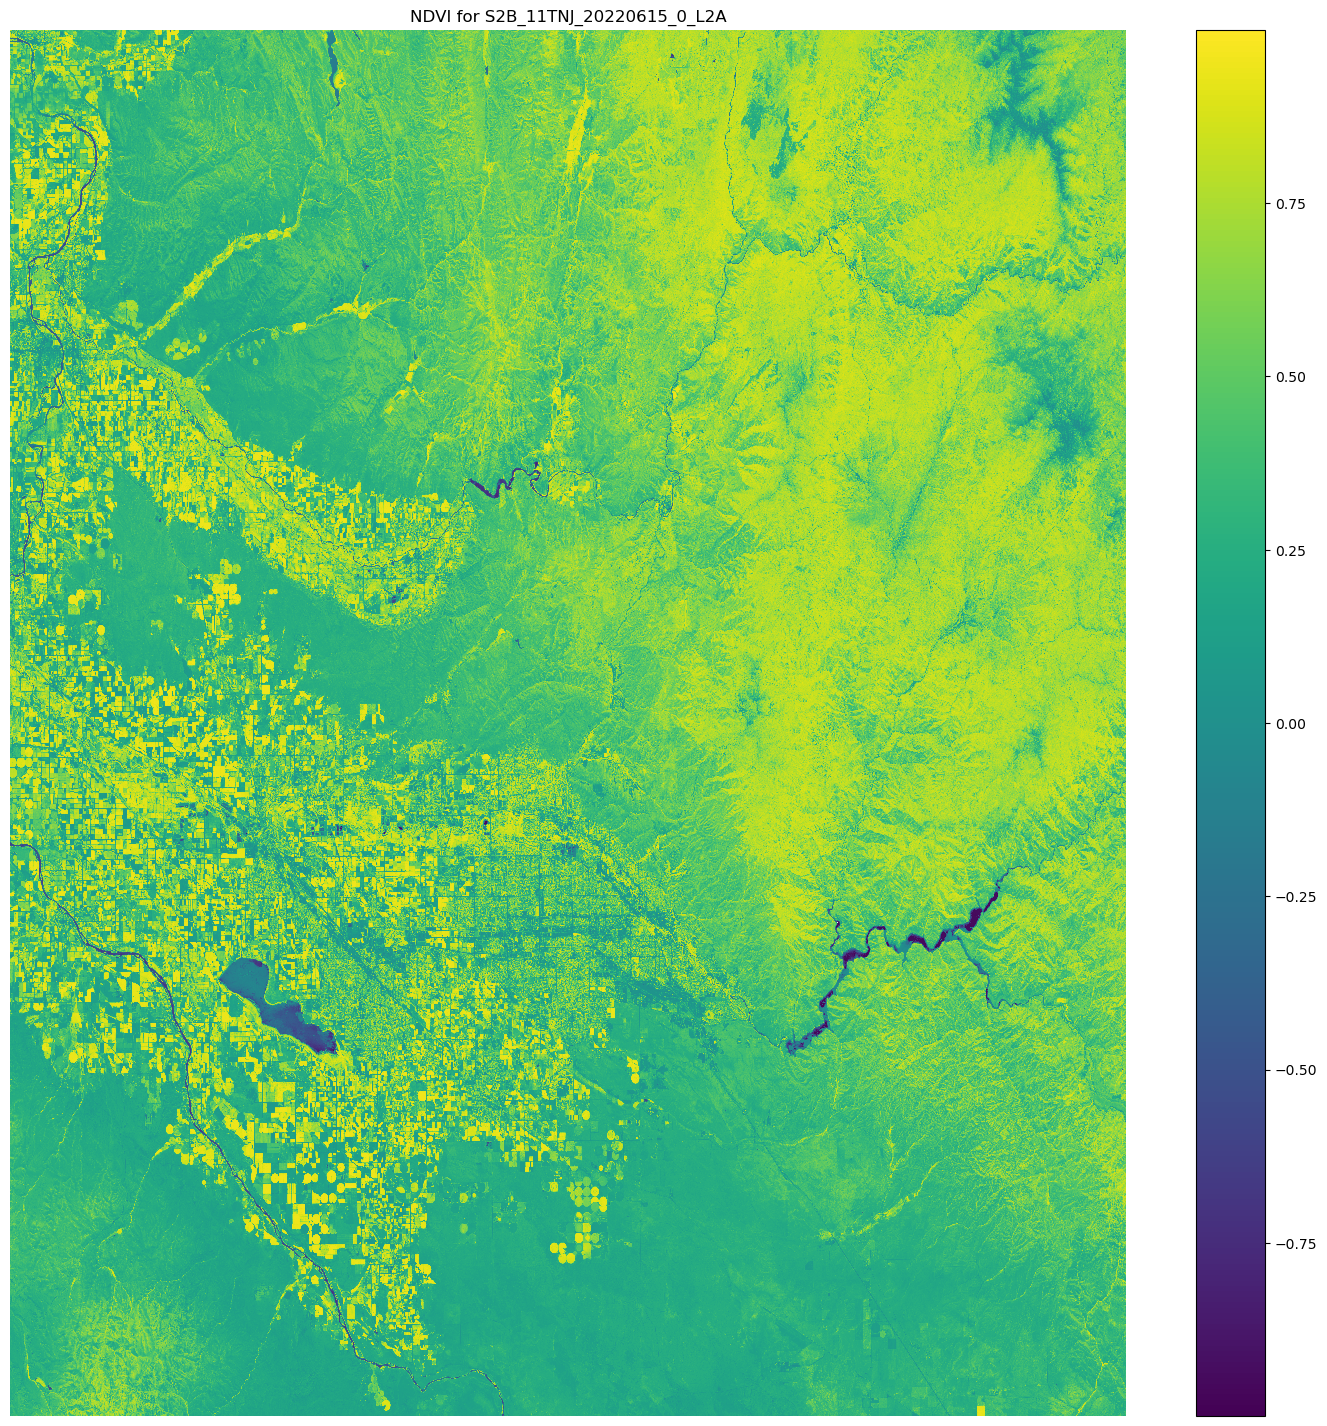
使用 matplotlib 可视化结果
使用 Matplotlib.open_rasterio()API操作打开影像数组,然后使用和中的NDVIred图像波段计算影像阵列 nir Sentinel-2 卫星数据。
# Opens the python arrays
import rioxarray

red_uri = items[25]["Assets"]["red"]["Href"]
nir_uri = items[25]["Assets"]["nir"]["Href"]

red = rioxarray.open_rasterio(red_uri, masked=True)
nir = rioxarray.open_rasterio(nir_uri, masked=True)

# Calculates the NDVI
ndvi = (nir - red)/ (nir + red)

# Common plotting library in Python
import matplotlib.pyplot as plt

f, ax = plt.subplots(figsize=(18, 18))
ndvi.plot(cmap='viridis', ax=ax)
ax.set_title("NDVI for {}".format(items[25]["Id"]))
ax.set_axis_off()
plt.show()
前面的代码示例的输出是上面叠加了NDVI值的卫星图像。接近 1 的NDVI值表示存在大量植被,接近 0 的值表示没有植被呈现。
使用 ScriptProcessor 的演示到此结束。
