AWS DRS recovery dashboard
The Recovery dashboard tab allows you to monitor the server, its data replication status, and view events and metrics in CloudTrail.

Last recovery
The Last recovery box provides an overview of the recovery process for the server.

Here, you can see the following:
-
Job type – The type of recovery job performed (drill or recovery)
-
Job ID – The ID of the last recovery job. Choose the Job Id to be redirected to the Job page for that specific recovery launch within the Recovery job history.
-
Job started – The date and time the last recovery job was started.
-
Job finished – The date and time the last recovery job was finished. This field will be blank if the job is still ongoing.
-
Current recovery instance status – The current status of the latest Recovery instance (if one has been launched).
-
Status taken at – The last date and time the current recovery instance status was queried.
Data replication status
The Data replication status section provides an overview of the overall source server status, including:

-
Replication progress – The percentage of the server's storage that was successfully replicated.
-
Rescan progress – The percentage of the server's storage that was rescanned (in the event of a rescan)
-
Total replicated storage – The total amount of storage replicated (in GiB).
-
Lag – Whether the server is experiencing any lag. If it is - the lag time is indicated.
-
Backlog – Whether there is any backlog on the server (in MiB)
-
Elapsed replication time – Time elapsed since replication first began on the server.
-
Last seen – The last time the server successfully connected to AWS Elastic Disaster Recovery.
-
Replication start time – The date and time replication first began on the server.
Data replication can be in one of several states, as indicated in the panel title:
-
Initial sync: initial copying of data from external servers is not done. Progress bar and Total replicated storage fields will indicate how far along the process is.
-
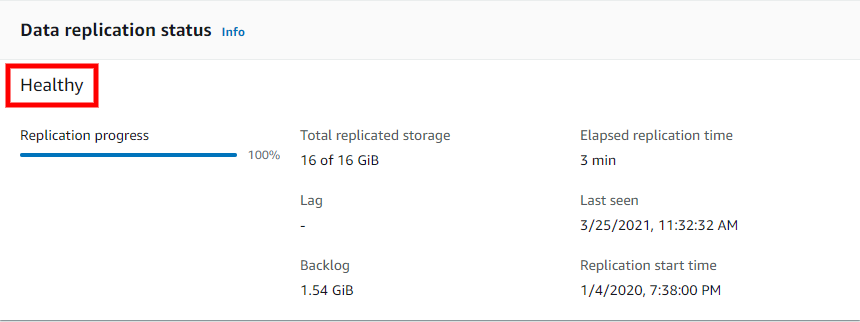
Healthy: all data has been copied and any changes at source are continuously being replicated (data is flowing).
-
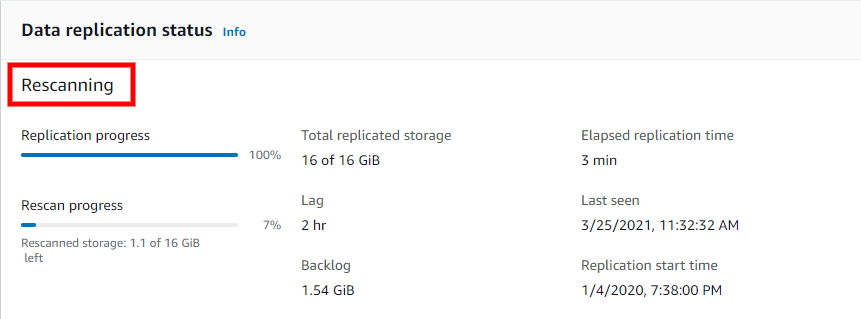
Rescan: an event happened that forced the agent on the external server to rescan all blocks on all replicated disks (same as initial sync but faster because only changed blocks need to be copied; a rescan progress bar will also appear).
-
Stalled: data is not flowing and user intervention is required (either initial sync will never complete, or state at source will become further and further the state at AWS). When the state is stalled, then the replication initiation checklist is also shown, indicating where the error occurred that caused the stalled state.
This panel also shows:
-
Total replicated storage: size of all disks being replicated for this source server, and how much has been copied to AWS (once initial sync is complete)
Lag: if you launch a recovery instance now, how far behind will it be from state at source. Normally this should be none.
Backlog: how much data has been written at source but has not yet been copied to AWS. Normally this should be none.
Last seen: when is the last time the AWS Replication Agent communicated with the AWS DRS service or the replication server.
If everything is working as it should and replication has finished initializing, the Data replication progress section will show a Healthy status.

If there are initialization, replication, or connectivity errors, the Data replication status section will show the cause of the issue (for example, a stall). If the error occurred during the initialization process, then the exact step during which the error occurred will be marked with a red "x" under Replication initiation steps.

Events and metrics
You can review AWS Elastic Disaster Recovery events and metrics in AWS CloudTrail. Click on View CloudTrail event history to open AWS CloudTrail in a new tab.

Learn more about AWS CloudTrail events in the AWS CloudTrail user guide.
Server actions and replication control
You can perform a variety of actions, control data replication, and manage your recovery and drill instances for an individual server from the server details view.
Actions menu
The Actions menu allows you to perform the following actions:

-
Add servers – Choosing this option will redirect you to the AWS Replication Agent installation instructions.
-
Edit replication settings – Choose this option to edit the replication settings for the selected server or group of servers through on the Edit replication settings tab.
-
Edit launch settings – Choose this option to enter the source server's Server details view > Launch settings tab.
-
View server details – Choose this option to enter the source server's Server details view.
-
Disconnect from AWS – Choose this option to disconnect the selected server from AWS Elastic Disaster Recovery and AWS.
On the Disconnect X server/s from service dialog, choose Disconnect.
Important
This will uninstall the AWS Replication Agent from the source server, and data replication will stop for the source server. This action will not affect any drill or recovery instances that have been launched for this source server, but you will no longer be able to identify which source servers your Amazon EC2 instances correspond to.
-
Delete server – Choose this option to permanently delete a source server from AWS Elastic Disaster Recovery. This will remove all information related to the server from the AWS Elastic Disaster Recovery service. You can only delete servers that have been disconnected from AWS. You will need to reinstall the AWS Replication Agent on a deleted source server to add it back to AWS Elastic Disaster Recovery.
When the Delete X servers dialog appears, click Permanently delete.
Initiate recovery job menu
The Initiate recovery job menu allows you to start drills and recoveries by launching drill and recovery instances as part of the overall failback process. You can learn more about the entire failback and failover process with AWS Elastic Disaster Recovery in the Performing a failback and failover with AWS Elastic Disaster Recovery documentation.

-
Initiate drill – Choose the Initiate drill option to launch a drill instance for this server or group of servers for the purpose of testing your recovery solution. You should perform periodic drills in order to ensure that you are ready for recovery. Learn more about launching drill instances in AWS Elastic Disaster Recovery.
-
Initiate recovery – Choose the Initiate recovery option to launch a recovery instances for this server or group of servers for the purpose of recovering the server in the event of a disaster. Learn more about launching recovery instances in AWS Elastic Disaster Recovery.
Alerts and errors
You can easily distinguish between healthy servers and servers that are experiencing issues on the Recovery dashboard in several ways.
The entire AWS Elastic Disaster Recovery Console is color-coded for ease of use.
Healthy servers with no errors are characterized by the color blue. The Data replication status boxes will display all steps and information in blue if the server is healthy.
The following are examples of healthy servers:

Servers that are experiencing temporary issues will be characterized by the color yellow. This can include issues such as lag or a rescan. These issues will not break replication, but may delay replication or indicate a bigger problem.
The following are examples of servers experiencing temporary issues:
Lagging server:

Rescanning server:

Servers that are experiencing serious issues will be characterized by the color red. These issues can include a loss of connection, a stall, or other issues. You will have to fix these issues in order for data replication to resume.
The Data replication status box will include details of the issue.

If the stall occurred during initiation, scroll down to Replication initiation steps. The exact step where the issue arose will be marked with a red "x".
