協助改進此頁面
本文為英文版的機器翻譯版本,如內容有任何歧義或不一致之處,概以英文版為準。
若要為本使用者指南貢獻內容,請點選每個頁面右側面板中的在 GitHub 上編輯此頁面連結。
本文為英文版的機器翻譯版本,如內容有任何歧義或不一致之處,概以英文版為準。
使用 Helm 部署 Prometheus
作為使用 Amazon Managed Service for Prometheus 的替代方案,您可以使用 Helm 將 Prometheus 部署到您的叢集中。如果您已經安裝了 Helm,可以使用 helm version 命令檢查您的版本。Helm 是 Kubernetes 叢集的套件管理工具。如需有關 Helm 及如何安裝它的詳細資訊,請參閱 在 Amazon EKS 上,使用 Helm 部署應用程式。
在您為 Amazon EKS 叢集設定 Helm 之後,即可用它來依照下列步驟部署 Prometheus。
-
建立 Prometheus 命名空間。
kubectl create namespace prometheus -
新增
prometheus-community圖表儲存庫。helm repo add prometheus-community https://prometheus-community.github.io/helm-charts -
部署 Prometheus。
helm upgrade -i prometheus prometheus-community/prometheus \
    --namespace prometheus \
    --set alertmanager.persistence.storageClass="gp2" \
    --set server.persistentVolume.storageClass="gp2"
注意
如果您在執行此命令
Error: failed to download "stable/prometheus" (hint: running helm repo update may help)時收到錯誤,請執行helm repo update prometheus-community,然後再次嘗試執行步驟 3 命令。如果收到錯誤
Error: rendered manifests contain a resource that already exists,請執行helm uninstall,然後嘗試再次執行步驟 3 命令。your-release-name-nnamespace -
確認
prometheus命名空間中的所有裝置皆處於READY狀態。kubectl get pods -n prometheus範例輸出如下。
NAME READY STATUS RESTARTS AGE prometheus-alertmanager-59b4c8c744-r7bgp 1/2 Running 0 48s prometheus-kube-state-metrics-7cfd87cf99-jkz2f 1/1 Running 0 48s prometheus-node-exporter-jcjqz 1/1 Running 0 48s prometheus-node-exporter-jxv2h 1/1 Running 0 48s prometheus-node-exporter-vbdks 1/1 Running 0 48s prometheus-pushgateway-76c444b68c-82tnw 1/1 Running 0 48s prometheus-server-775957f748-mmht9 1/2 Running 0 48s -
使用
kubectl將 Prometheus 主控台的連接埠轉送到本機機器。kubectl --namespace=prometheus port-forward deploy/prometheus-server 9090 -
將 Web 瀏覽器連接至
http://localhost:9090以檢視 Prometheus 主控台。 -
從 – insert metric at cursor (- 在游標處插入指標) 功能表中選擇一個指標,然後選擇 Execute (執行)。選擇 Graph (圖表) 標籤以顯示一段時間內的指標。下圖顯示一段時間內的
container_memory_usage_bytes。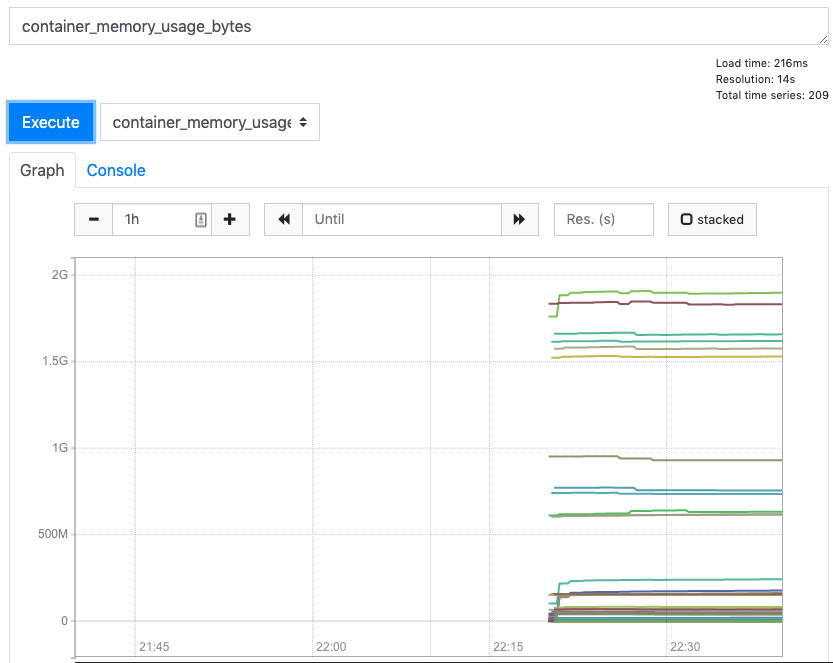
-
選擇頂部導覽列中的 Status (狀態),然後選擇 Targets (目標)。
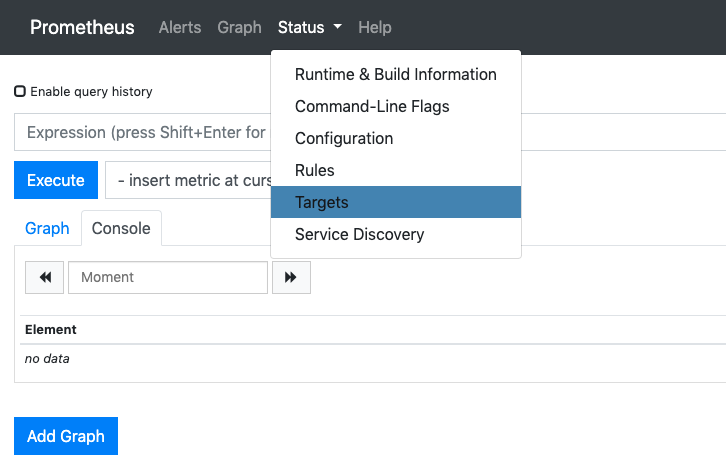
將會顯示使用服務探索連接至 Prometheus 的所有 Kubernetes 端點。
