本文為英文版的機器翻譯版本,如內容有任何歧義或不一致之處,概以英文版為準。
快速入門:使用範例資料以單一視覺效果建立 Amazon QuickSight 分析
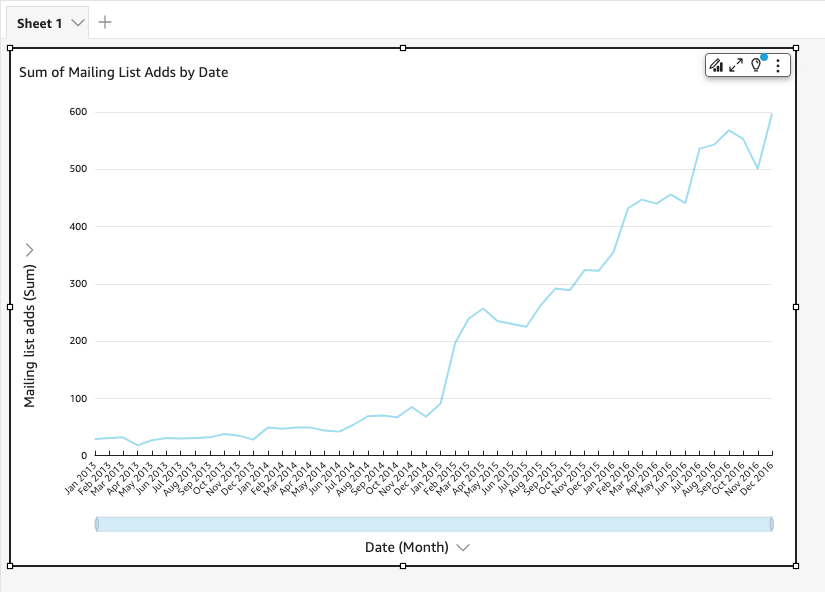
在以下程序中,利用 Web and Social Media Analytics 範例資料集建立包含折線圖的分析。此視覺化效果會按月顯示已將自己新增至郵寄清單的人員計數。
使用範例資料集建立包含折線圖的分析
-
在 Amazon 開 QuickSight 始頁面上,選擇 [新增分析]。如果您沒有樣本數據,則可以從 web-and-social-analytics.cs v.zip 下載它。解壓縮檔案,以便您可以使用 .csv 檔案。
若要上傳範例資料,請執行下列動作:
-
選擇新資料集。您也可以從 [資料集] 頁面新增資料集。若要這麼做,請選擇 [資料集],然後選擇 [新增資料集]。
-
選擇 Upload a file (上傳檔案)。
-
從您的磁碟機選擇範例檔案
web-and-social-analytics.csv。如果您沒有看到檔案,請檢查您是否已解壓縮web-and-social-analytics.csv.zip檔案。 -
透過在確認檔案上傳設定畫面選擇下一步,確認檔案上傳設定。
-
在資料來源詳細資訊畫面上選擇視覺化。
-
跳至下一個步驟。選擇 Visualize (視覺化效果) 會帶您前往與步驟 2 的處理相同的畫面。
-
-
在資料集頁面上,選擇 Web and Social Media Analytics 資料集,然後選擇建立分析。
-
在 [資料] 窗格中,選擇 [日期],然後選擇 [郵件清單新增]。
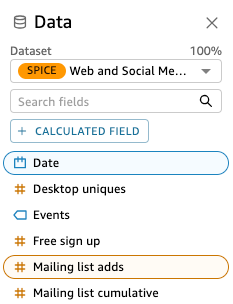
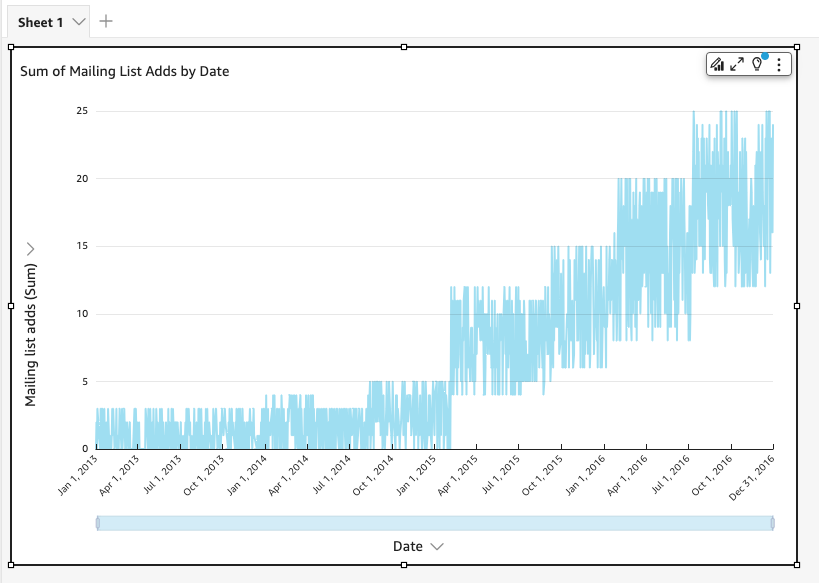
Amazon QuickSight 使 AutoGraph 用創建可視化,選擇它確定與這些字段最兼容的可視類型。在本例中,所選取的是可顯示按日期新增的郵寄清單的折線圖,日是預設的日期精細程度。
-
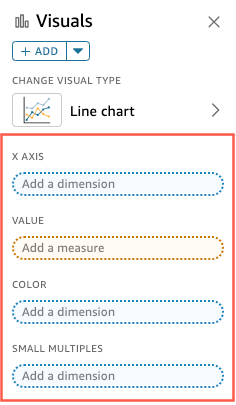
導覽至「視覺效果」窗格底部的「欄位」井。
-
選擇 X axis (X 軸) 欄位,選擇 Aggregate (彙總),然後選擇 Month (月)。
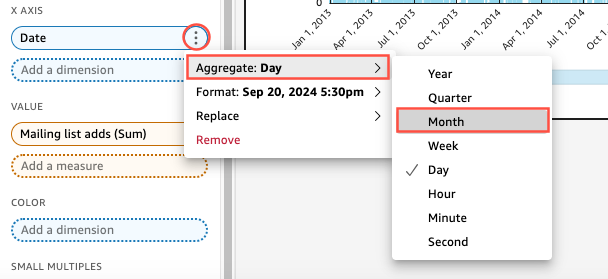
折線圖會更新以顯示每月新增的郵寄清單,而不是預設的每年。
