本文為英文版的機器翻譯版本,如內容有任何歧義或不一致之處,概以英文版為準。
樞紐分析表計算的套用方式
您可以如下所述套用資料表計算。資料表計算一次只會套用到一個欄位。因此,如果您的樞紐分析表有多個值,則套用計算的儲存格只限於代表您已套用計算的欄位。
資料表橫越
使用 Table across (表格橫越) 會沿著樞紐分析表的各列套用計算,而不考慮任何分組。此為預設的套用方式。例如,以下列樞紐分析表為例。
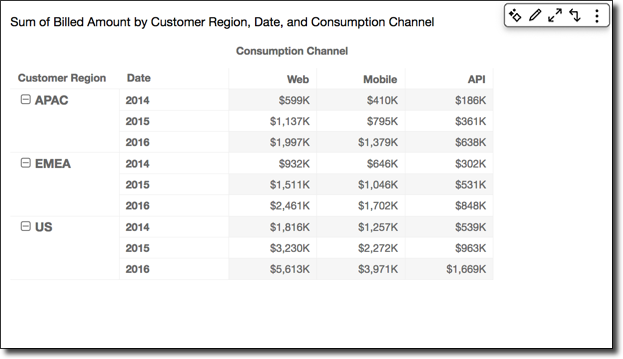
使用資料表橫越來套用累計加總函數會得到以下結果,資料列總計位於最後一欄。
資料表向下
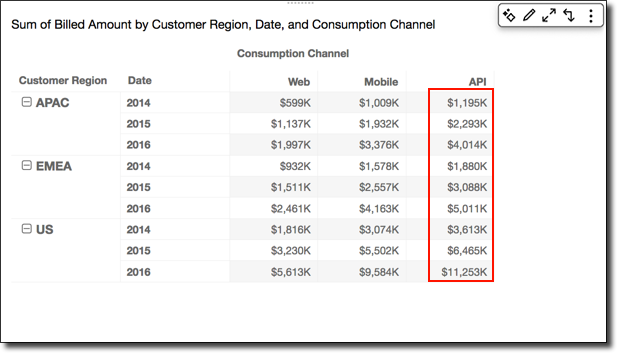
使用 Table down (表格向下) 會沿著樞紐分析表的各欄向下套用計算,而不考慮任何分組。
使用資料表向下來套用累計加總函數會得到以下結果,資料欄總計位於最後一列。

資料表橫越向下
使用 Table across down (表格橫越向下) 會沿著樞紐分析表的各列套用計算,得到結果後再沿著樞紐分析表的各欄向下重新套用計算。
使用資料表橫越向下對資料表列套用累計加總函數會得到以下結果。在此情況下,總計將以橫向及縱向求出總和,最後總計顯示於右下儲存格。

在這種情況下,假設您使用資料表橫越向下套用排名函數。則其將先沿著表格列決定初始排名,再沿著各欄向下排名。最後得到的結果如下。

資料表向下橫越
使用 Table down across (表格向下橫越) 會沿著樞紐分析表的各欄向下套用計算,得到結果後再沿著樞紐分析表的各列重新套用計算。
您可以使用資料表向下橫越對資料表列套用累計加總函數,以得到以下結果。在此情況下,總計將以橫向及縱向求出總和,最後總計顯示於右下儲存格。
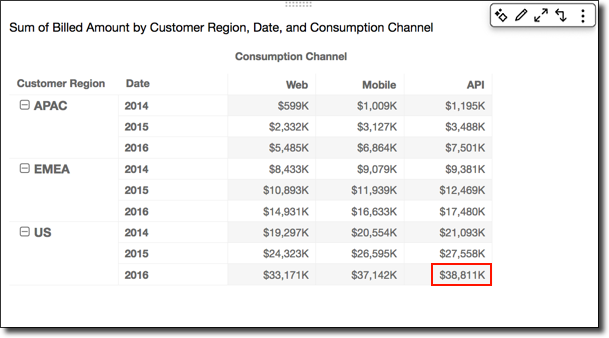
您可以使用資料表向下橫越對資料表列套用排名函數,以得到以下結果。在此情況下,其將先沿著表格欄向下決定初始排名,再沿著各列進行排名。

群組橫越
使用 Group across (群組橫越) 會在群組邊界內 (取決於套用到欄的第二層分組) 沿著樞紐分析表的各列套用計算。例如,若您先依欄位 2 分組再依欄位 1 分組,其將在欄位 2 層級套用分組。如果是依欄位 3、欄位 2 和欄位 1 的順序分組,則同樣會在欄位 2 層級套用分組。若未進行任何分組,Group across (群組橫越) 傳回的結果將與 Table across (表格橫越) 相同。
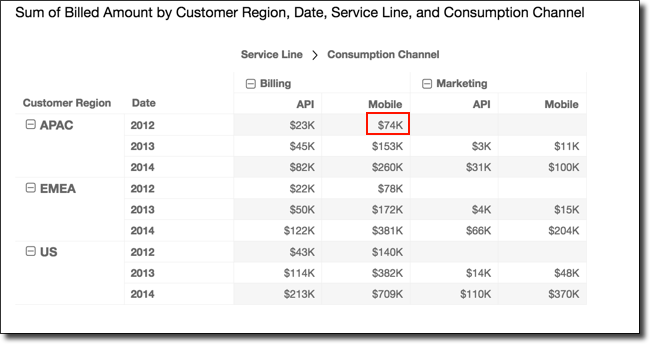
例如,以下的樞紐分析表是將各欄先依 Service Line 分組,再依 Consumption
Channel 分組。

您可以使用群組橫越對資料表列套用累計加總函數,以得到以下結果。在此情況下,其將沿著由每個服務類別群組的欄劃定邊界的各列逐次套用函數。Mobile 欄針對特定列所代表的 Customer
Region 和 Date (年份),顯示特定 Service Line 的兩個 Consumption Channel 值的總計。例如,圖中標明的儲存格代表 Service
Line 為 Billing 的所有 Consumption Channel 值,其 APAC 區域於 2012 年的總計。
群組向下
使用 Group down (群組向下) 會在群組邊界內 (取決於套用到列的第二層分組) 沿著樞紐分析表的各欄向下套用計算。例如,若您先依欄位 2 分組再依欄位 1 分組,其將在欄位 2 層級套用分組。如果是依欄位 3、欄位 2 和欄位 1 的順序分組,則同樣會在欄位 2 層級套用分組。若未進行任何分組,Group down (群組向下) 傳回的結果將與 Table down (表格向下) 相同。
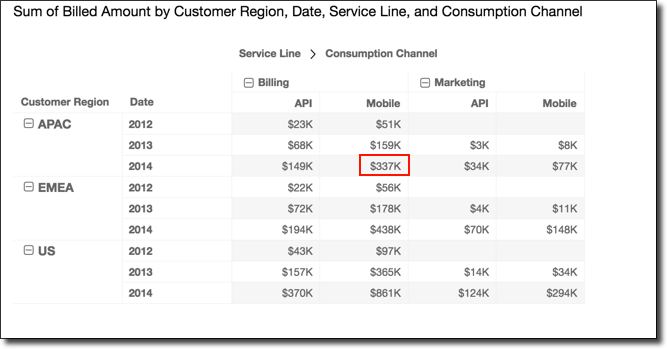
例如,以下的樞紐分析表是將各列先依 Customer Region 分組,再依 Date (年份) 分組。

您可以使用群組向下對資料表列套用累計加總函數,以得到以下結果。在此情況下,其將沿著由每個 Customer Region 群組的列劃定邊界的各欄向下套用函數。2014 列針對特定欄所代表的 Service Line 和 Consumption Channel,顯示特定 Customer
Region 在所有年份的總計。例如,圖中標明的儲存格代表報告中顯示的所有 Date (年份) 值,其 Mobile 管道的 Billing 服務於 APAC 區域的總計。
群組橫越向下
使用 Group across down (群組橫越向下) 會在群組邊界內 (取決於套用到欄的第二層分組) 沿著各列套用計算。函數得到結果後再沿著樞紐分析表的各欄向下重新套用計算。群組邊界同樣取決於套用到列的第二層分組。
例如,若您先依欄位 2 再依欄位 1 將列或欄分組,其將在欄位 2 層級套用分組。如果是依欄位 3、欄位 2 和欄位 1 的順序分組,則同樣會在欄位 2 層級套用分組。若未進行任何分組,Group across down (群組橫越向下) 傳回的結果將與 Table across down (表格橫越向下) 相同。
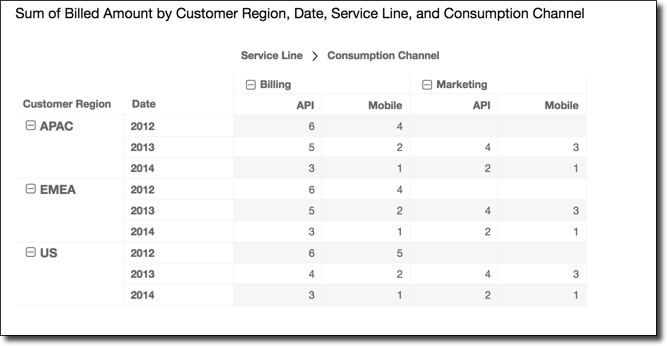
例如,以下的樞紐分析表是將各欄先依 Service Line 分組,再依 Consumption
Channel 分組。各列將先依 Customer Region 分組,再依 Date (年份) 分組。

您可以使用群組橫越向下對資料表列套用累計加總函數,以得到以下結果。在此情況下,總計將於群組邊界內以橫向及縱向求出總和。本例中,欄的邊界是 Service Line,而列的邊界是 Customer Region。最後總計顯示於群組的右下儲存格。

您可以使用群組橫越向下對資料表列套用排名函數,以得到以下結果。在此情況下,其將先沿著由每個 Service Line 群組劃定邊界的各列逐次套用函數。隨後還會再次對第一次計算的結果套用函數,而這次是沿著由每個 Customer Region 群組劃定邊界的各欄向下套用。
群組向下橫越
使用 Group down across (群組向下橫越) 會在群組邊界內 (取決於套用到列的第二層分組) 沿著各欄向下套用計算。然後,Amazon 獲 QuickSight 取結果並在數據透視表的行中重新應用計算。同樣地,在群組邊界內 (取決於套用到欄的第二層分組) 會重新套用計算。
例如,若您先依欄位 2 再依欄位 1 將列或欄分組,其將在欄位 2 層級套用分組。如果是依欄位 3、欄位 2 和欄位 1 的順序分組,則同樣會在欄位 2 層級套用分組。若未進行任何分組,Group down across (群組向下橫越) 傳回的結果將與 Table down across (表格向下橫越) 相同。
例如,以下列樞紐分析表為例。各欄將先依 Service Line 分組,再依 Consumption
Channel 分組。各列將先依 Customer Region 分組,再依 Date (年份) 分組。

您可以使用群組向下橫越對資料表列套用累計加總函數,以得到以下結果。在此情況下,總計將於群組邊界內以橫向及縱向求出總和。本例中,欄的邊界是 Service Category,而列的邊界是 Customer Region。最後總計顯示於群組的右下儲存格。

您可以使用群組橫越向下對資料表列套用排名函數,以得到以下結果。在此情況下,其將先沿著由每個 Customer Region 群組劃定邊界的各欄向下套用函數。隨後還會再次對第一次計算的結果套用函數,而這次是沿著由每個 Service Line 群組劃定邊界的各列逐次套用。
