Amazon QuickSight dashboard visuals
The following dashboards are examples of dashboard visuals that this solution deploys with Amazon QuickSight. These examples use a dark midnight theme, but your dashboards may use a different theme.
Code change volume dashboard
This dashboard displays the number of code changes made by author and repository. It provides a weekly, monthly and aggregated view of the metrics by author and repository. You can filter data by author, repository, branch, AWS account, AWS Region, tag, or time period (default to last 90 days) using the custom filter as needed. For more information about the metrics, refer to Code change volume metrics.

Code change volume dashboard
Mean time to recover dashboard
This dashboard displays outage minutes by application and the average time it takes to restore an application from a failure to success state. It provides a weekly, monthly and aggregated view of the metrics by application. You can filter data by application type, application name, AWS account, AWS Region, or time period (default to last 90 days) using the custom filter as needed. For more information about the metrics, refer to Mean time to recover metrics.

Mean time to recover dashboard
Change failure rate dashboard
This dashboard displays the frequency of deployment failures per application by measuring the ratio of unsuccessful to total deployments. It provides a weekly, monthly and aggregated view of the metrics by application. You can filter metrics by application, AWS account, AWS Region, or time period (default to last 90 days) using the custom filter. For more information about the metrics, refer to Change failure rate metrics.

Change failure rate dashboard
Deployment dashboards
This dashboard displays the deployment frequency and state (success/failure) by application. It provides a weekly, monthly and aggregated view of the metrics by application. You can filter metrics by application, AWS account, AWS Region, or time period (default to last 90 days) using the custom filter. For more information about the metrics, refer to Deployment metrics.

Deployment dashboard
Build dashboards
Build activity dashboard
This dashboard displays the code build frequency, duration and state (success/failure) by project. It provides a weekly, monthly, and aggregated view of the metrics by project. You can filter metrics by project, metric name (for example, FailedBuilds, SucceededBuilds, and others), AWS account, AWS Region, tag, or time period (default to last 90 days) using the custom filter. For more information about the metrics, refer to Build metrics.

Build activity dashboard - 1

Build activity dashboard - 2

Build activity dashboard - 3
Build resource utilization dashboard
This dashboard displays code build resource utilization metrics for CPU, memory, and storage utilization by project and build. It provides a weekly, monthly, and aggregated view of the metrics by projects and build. You can filter metrics by project name, metric name (for example, CPUUtilized, MemoryUtilized and others), AWS account, AWS Region, tag, or time period (default to last 90 days) using the custom filter. Resource utilization metrics are not available for builds shorter than one minute and they are not supported in all the AWS Regions where AWS CodeBuild is supported. For a complete list of the supported Regions, refer to Monitoring CodeBuild resource utilization metrics in the AWS CodeBuild User Guide. For more information about the metrics, refer to Build metrics.

Build resource utilization dashboard - 1

Build resource utilization dashboard - 2

Build resource utilization dashboard - 3
Pipeline dashboard
This dashboard displays pipeline execution state (failure, success, and others), execution duration and frequency in addition to the state at stage and action level. It provides a weekly, monthly, and aggregated view of the metrics by pipeline. You can filter metrics by pipeline, AWS account, AWS Region, tag, or time period (default to last 90 days) using the custom filter. For more information about the metrics, refer to Pipeline metrics.

Pipeline dashboard - 1

Pipeline dashboard - 2
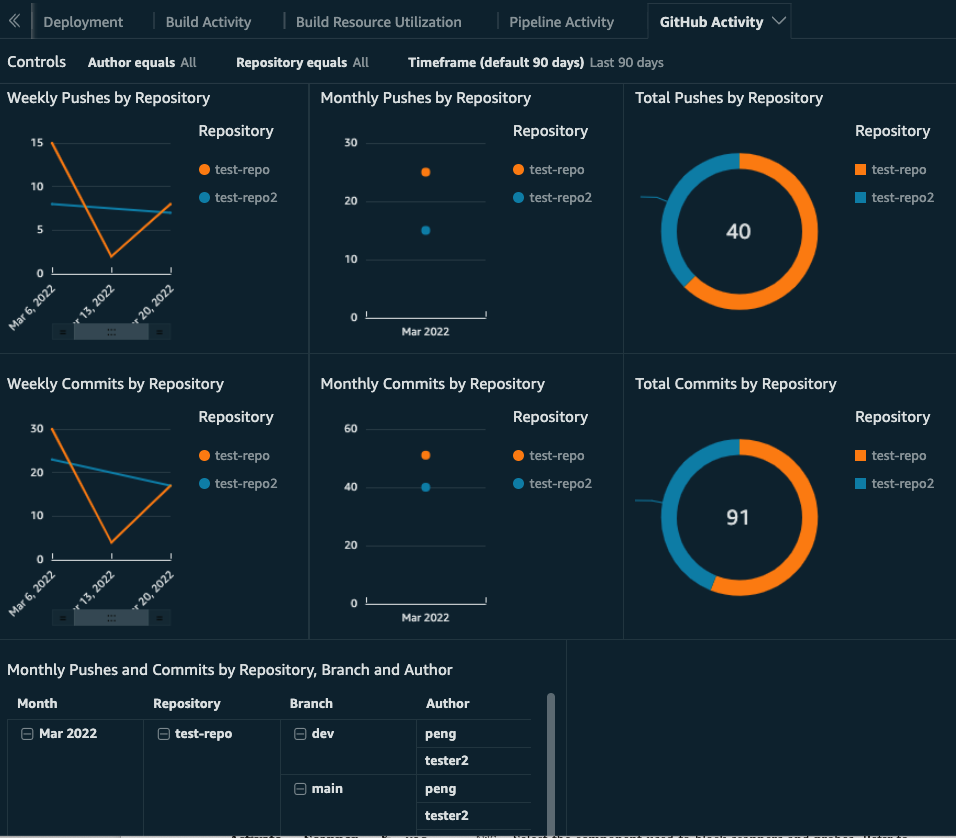
GitHub activity dashboard
This dashboard displays the number of code changes (pushes and commits) made by author and repository. It provides a weekly, monthly, and aggregated view of the metrics by author and repository. You can filter data by author, repository, or time period (default to last 90 days) using the custom filter as needed. For more information about the metrics, refer to GitHub activity metrics.

GitHub activity dashboard - 1
GitHub activity dashboard - 2
