Die vorliegende Übersetzung wurde maschinell erstellt. Im Falle eines Konflikts oder eines Widerspruchs zwischen dieser übersetzten Fassung und der englischen Fassung (einschließlich infolge von Verzögerungen bei der Übersetzung) ist die englische Fassung maßgeblich.
Das Datenbankinstanz-Dashboard für CloudWatch Database Insights anzeigen
Verwenden Sie das Database Instance Dashboard, um einen Snapshot des Zustands einer DB-Instance anzuzeigen.
Informationen zur Analyse von Sperrbäumen und Ausführungsplänen für Amazon Aurora PostgreSQL finden Sie in den folgenden Themen.
Themen
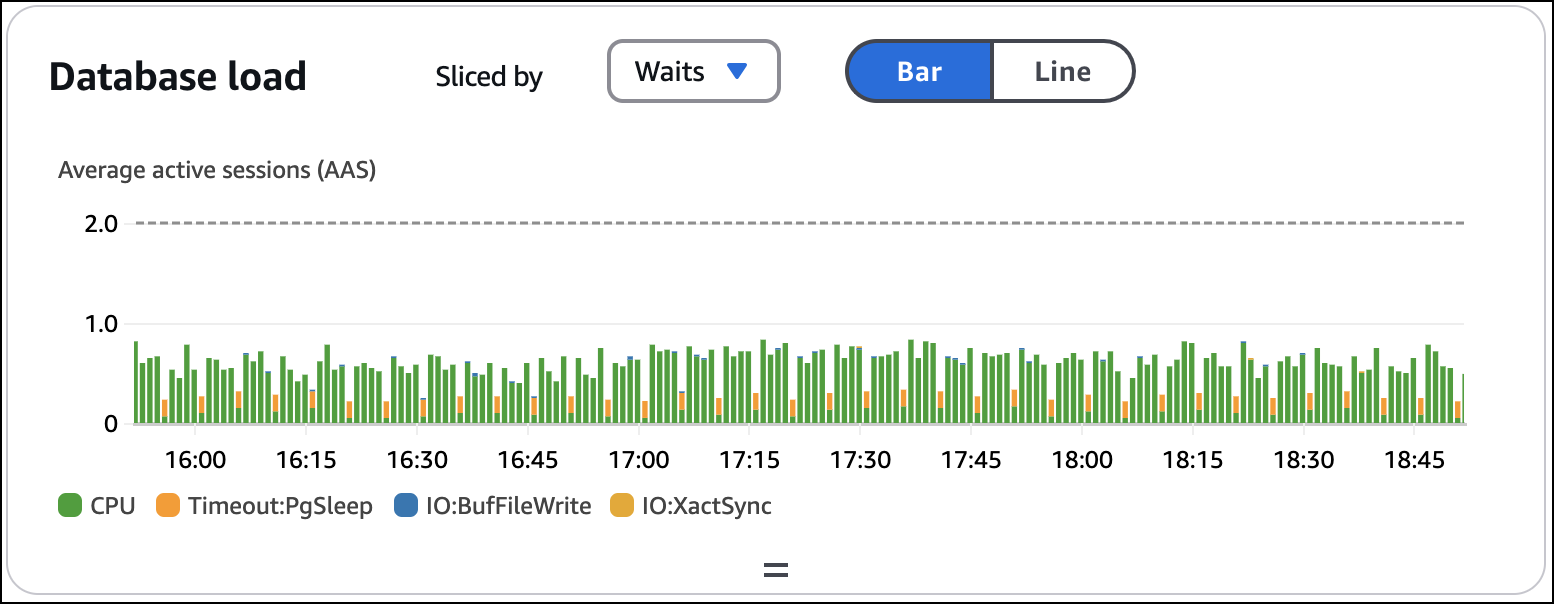
Datenbank-Ladediagramm
Die Datenbanklast (DB Load) misst den Grad der Sitzungsaktivität in Ihrer Datenbank. DB Load ist die wichtigste Metrik in Database Insights, und Database Insights erfasst jede Sekunde die DB-Auslastung.
Weitere Informationen zu DB Load finden Sie unter Database load im Amazon Aurora Aurora-Benutzerhandbuch.
Verwenden Sie das Diagramm zur Datenbankauslastung, um die Datenbanklast aufgeteilt (gruppiert) nach den folgenden Dimensionen anzuzeigen.
Objekt blockieren (nur für Amazon Aurora PostgreSQL)
Sitzung blockieren (nur für Amazon Aurora PostgreSQL)
Blockieren von SQL (nur für Amazon Aurora PostgreSQL)
Datenbank
Host
SQL
Benutzer
Waits (Warteereignis)
Anwendung (nur für Amazon Aurora PostgreSQL)
Pläne (nur für Amazon Aurora PostgreSQL)
Sitzungstyp (nur für Amazon Aurora PostgreSQL)

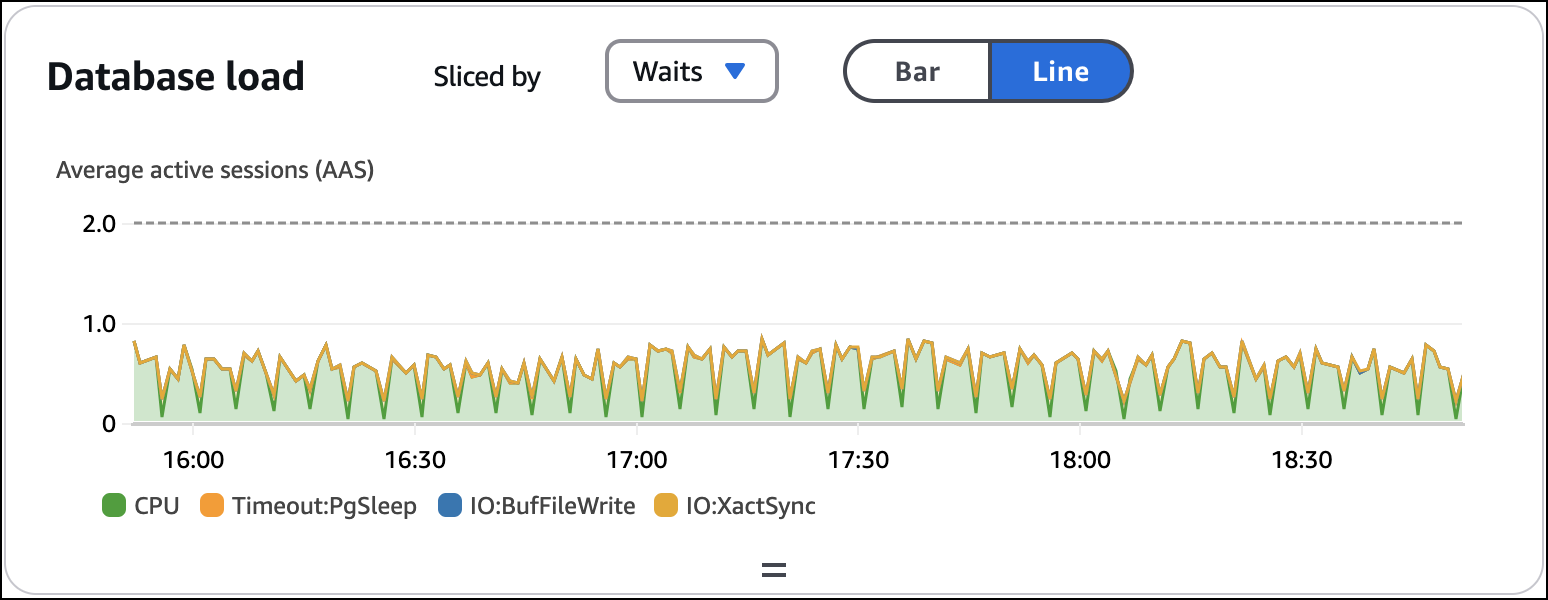
CloudWatch Zeigt DB Load standardmäßig in einem Balkendiagramm an. Wählen Sie Linie, um DB Load mit einem gestapelten Liniendiagramm anzuzeigen.

Registerkarte „Analyse der Datenbanklast“
Verwenden Sie die Registerkarte DB-Lastanalyse, um die wichtigsten Beiträge zu DB Load für jede der folgenden Dimensionen zu überwachen.
Datenbank
Host
SQL
Benutzer
Waits (Warteereignis)
Anwendung (nur für Amazon Aurora PostgreSQL)
Sitzungstyp (nur für Amazon Aurora PostgreSQL)
Analysieren Sie Statistiken für eine Abfrage
Möglicherweise möchten Sie Statistiken für eine Abfrage mit einer hohen DB-Auslastung analysieren. Gehen Sie wie folgt vor, um Statistiken für eine Abfrage zu analysieren.
Um Statistiken für Abfragen zu analysieren
Melden Sie sich bei der an AWS Management Console und öffnen Sie die CloudWatch Konsole unter https://console.aws.amazon.com/cloudwatch/
. Wählen Sie Insights.
Wählen Sie Database Insights.
Wählen Sie die Ansicht Database Instance aus.
Wählen Sie eine DB-Instance aus.
Wählen Sie das SymbolHaupt-SQLTabulatortaste
Um Statistiken für eine Abfrage anzuzeigen, wählen Sie eine Abfrage aus.
Registerkarte „Datenbank-Telemetrie“
Verwenden Sie die Registerkarte Datenbank-Telemetrie, um Metriken und Protokolle für die ausgewählte Instanz anzuzeigen.
Abschnitt „Metriken“ für Datenbanktelemetrie
Im Bereich Metriken wird ein Metrik-Dashboard angezeigt, das für jeden Engine-Typ angepasst ist.
Abschnitt „Protokolle“ für Datenbanktelemetrie
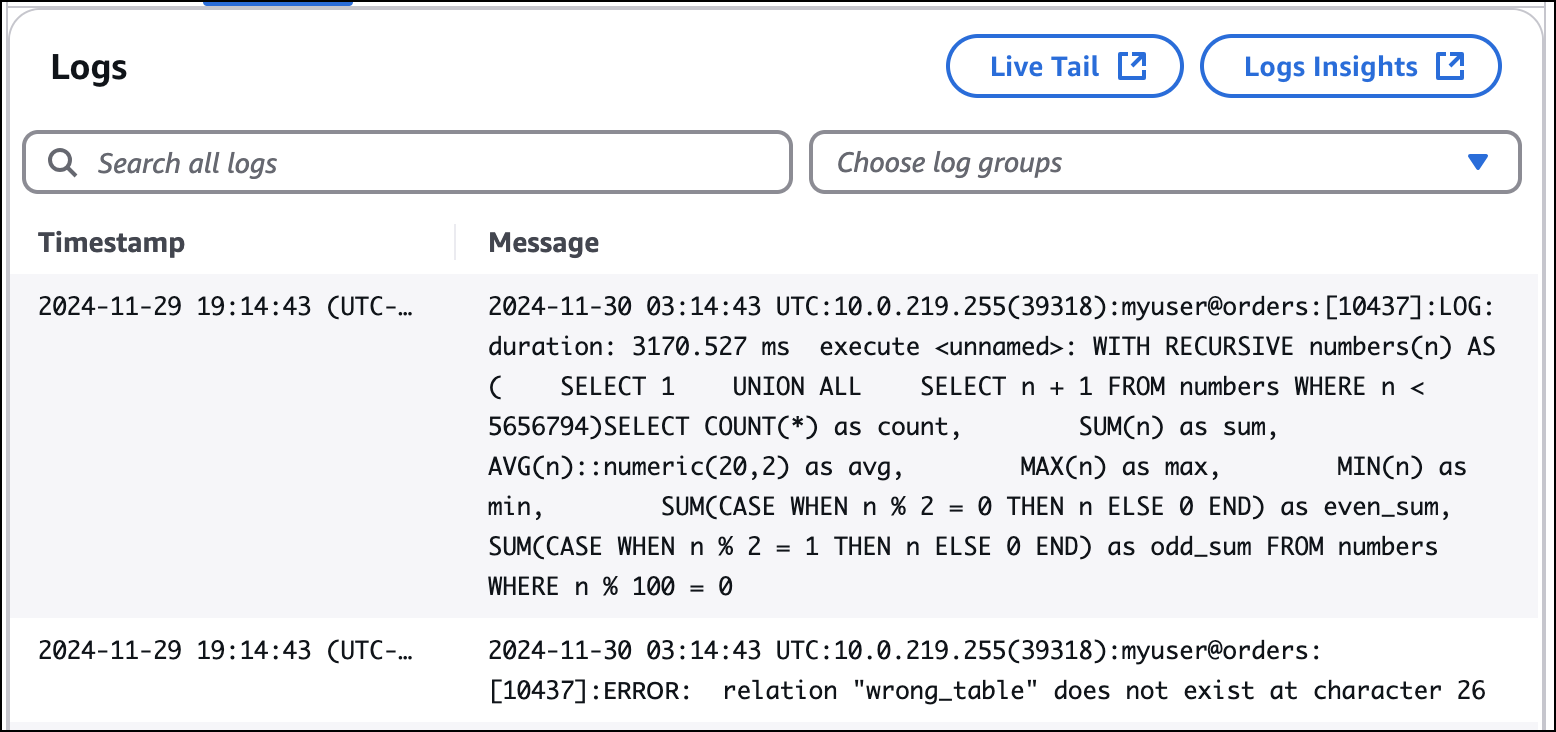
Der Abschnitt Logs bietet eine Ansicht der Datenbankprotokolle, die für die ausgewählte DB-Instance in CloudWatch Logs exportiert wurden.

Informationen zum Veröffentlichen von Protokollen in CloudWatch Logs for Amazon Aurora finden Sie unter Veröffentlichen von Datenbankprotokollen in Amazon CloudWatch Logs im Amazon Aurora Aurora-Benutzerhandbuch.
Amazon RDS und OS verarbeiten Daten für Datenbanktelemetrie
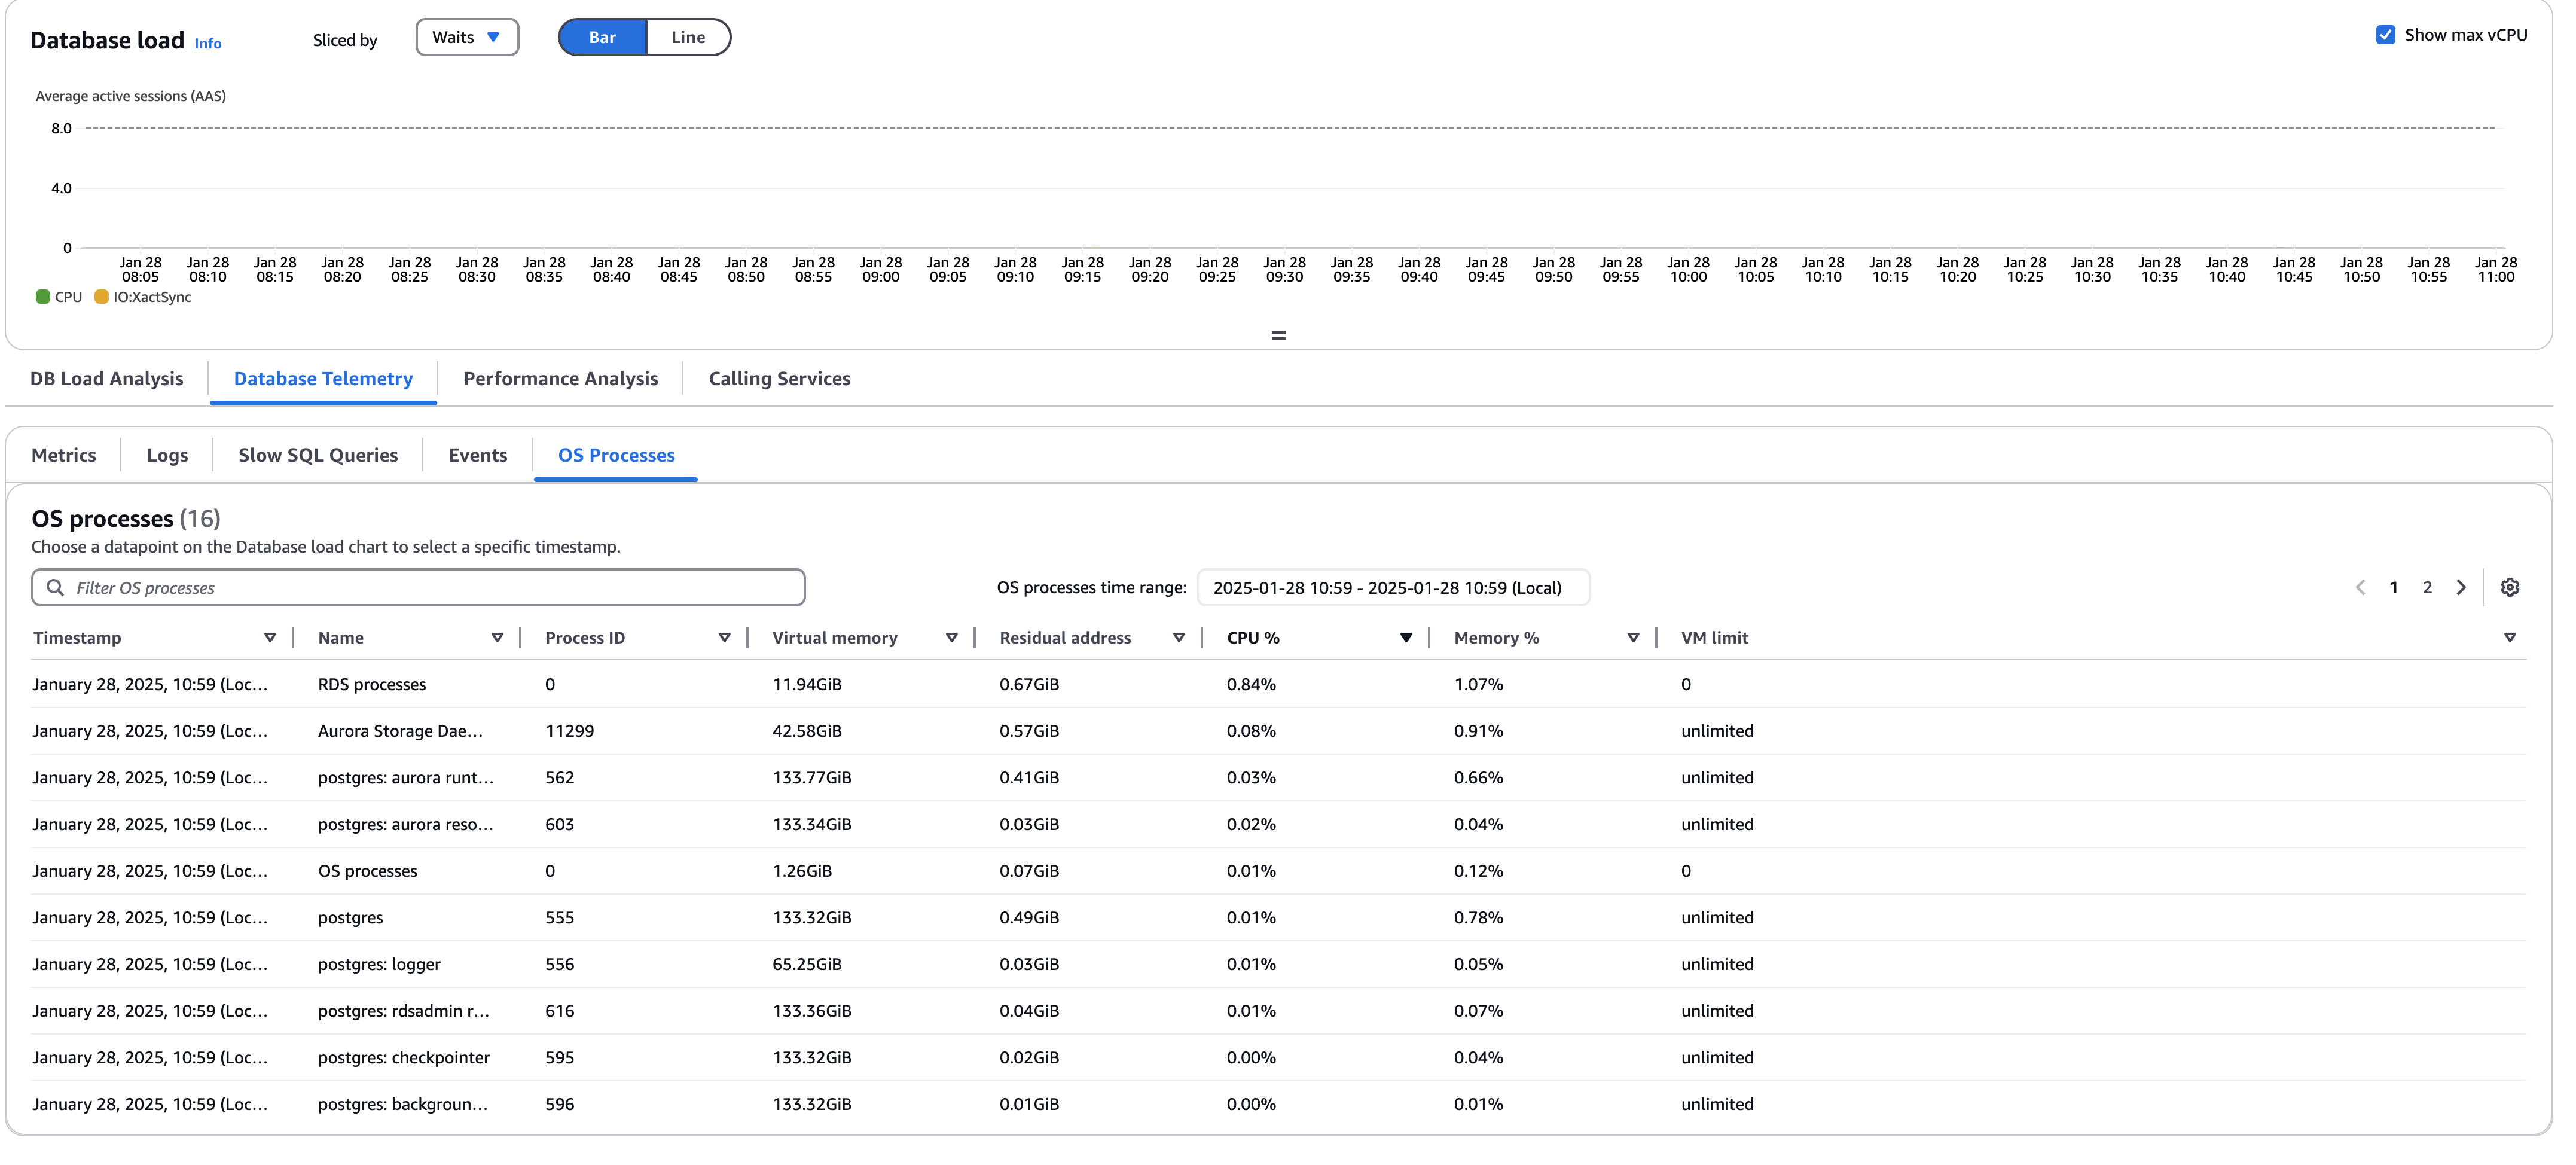
Sie können die Registerkarte „Betriebssystemprozesse“ auf der Registerkarte „Datenbank-Telemetrie“ verwenden, um Metriken für das Betriebssystem (OS) anzuzeigen, auf dem Ihre DB-Instance ausgeführt wird. Die Metriken bieten eine Momentaufnahme der Betriebssystemprozesse, die in Ihren Datenbanken für einen bestimmten Zeitstempel ausgeführt werden, sowie wichtige Kennzahlen wie Speicher- und CPU-Auslastung für jeden laufenden Prozess. Database Insights korreliert diese Metriken mit den Metriken in Ihrem Datenbank-Ladediagramm. Wenn Sie also einen Datenpunkt im Datenbank-Ladediagramm auswählen, werden die Prozessdaten des Betriebssystems aktualisiert, sodass Telemetrie mit demselben Zeitstempel angezeigt wird.
Wenn Sie einen Datenpunkt auswählen, wählt Database Insights automatisch den anzuzeigenden Zeitraum aus, je nachdem, welchen Zeitraum Sie für die gesamte Seite ausgewählt haben. Wie weit Sie zurückgehen können, hängt von der Aufbewahrungszeit ab, die Sie für die RDSOSMetrics Protokollgruppe konfiguriert haben.
Wenn Sie keinen Zeitstempel ausgewählt haben, enthält die Tabelle standardmäßig Telemetrie für den neuesten Zeitstempel.
Anmerkung
Betriebssystemprozessinformationen sind nur verfügbar, wenn Sie Amazon RDS Enhanced Monitoring aktiviert haben. Für die erweiterte Überwachung fallen zusätzliche Gebühren an. Weitere Informationen finden Sie unter Kosten der erweiterten Überwachung.

In der Betriebssystemprozessansicht werden die folgenden Daten für jeden Prozess angezeigt:
-
Prozess-ID — Die ID dieses Prozesses.
-
Virtueller Speicher — Die Menge des virtuellen Speichers, der dem Prozess zugewiesen wurde, in Kibibyte.
-
Restadresse — Der tatsächliche physische Speicher, der vom Prozess verwendet wird.
-
CPU% — Der Prozentsatz der gesamten CPU-Bandbreite, der vom Prozess genutzt wird.
-
Arbeitsspeicher% — Der Prozentsatz des gesamten Speichers, der vom Prozess genutzt wird.
-
VM-Limit — Die maximale Menge an virtuellem Speicher, die dem Prozess zugewiesen werden kann.
Wenn der Wert in dieser Spalte 0 ist, gelten die VM-Grenzwerte für diesen Prozess nicht.
Die angezeigten Überwachungsdaten werden aus Amazon CloudWatch Logs abgerufen. Sie können diese Metriken auch direkt aus dem Log-Stream in CloudWatch Logs abrufen. Weitere Informationen finden Sie unter Betriebssystem-Metriken mithilfe von CloudWatch Protokollen anzeigen.
Metriken für Betriebssystemprozesse werden in den folgenden Fällen nicht zurückgegeben:
-
Ein Failover der Datenbankinstanz.
-
Änderung der Instanzklasse der Datenbankinstanz (Scale Compute).
Bei einem Neustart einer Datenbankinstanz werden Metriken für Betriebssystemprozesse zurückgegeben, da nur die Datenbank-Engine neu gestartet wird. Metriken für das Betriebssystem werden weiterhin mitgeteilt.
Abschnitt „Langsame SQL-Abfragen“ für Datenbanktelemetrie
Um langsame SQL-Abfragen und Abfragemuster anzuzeigen, müssen Sie Protokollexporte in CloudWatch Logs aktivieren und DB-Parameter für Ihre Datenbank konfigurieren.
Informationen zum Veröffentlichen von Protokollen in CloudWatch Logs finden Sie in den folgenden Themen.
Informationen zur Konfiguration von DB-Parametern für Ihre Datenbank finden Sie unter Konfiguration Ihrer Datenbank zur Überwachung langsamer SQL-Abfragen mit Database Insights im Amazon Aurora Aurora-Benutzerhandbuch.
Der Abschnitt Langsame SQL-Abfragen enthält eine nach Häufigkeit sortierte Liste langsamer Abfragemuster. Wenn Sie ein Muster auswählen, können Sie eine Liste langsamer Abfragen anzeigen, die dem ausgewählten Muster entsprechen. Sie können die Liste langsamer Abfragen verwenden, um langsame Abfragen zu identifizieren, die sich auf Ihre DB-Instance auswirken.
Database Insights zeigt Statistiken für langsame Abfragen an. Die Statistiken stellen nur Abfragen dar, die den konfigurierten Schwellenwert für die Dauer langsamer Abfragen überschreiten.
Wichtig
Langsame Abfragen können vertrauliche Daten enthalten. Maskieren Sie Ihre sensiblen Daten mit CloudWatch Logs. Weitere Informationen zum Maskieren von Protokolldaten finden Sie unter Hilfe zum Schutz sensibler Protokolldaten durch Maskierung im Amazon CloudWatch Logs-Benutzerhandbuch.
Tabelle mit Ereignissen
Verwenden Sie die Ereignistabelle, um RDS-Ereignisse für Ihre DB-Instance anzuzeigen. Eine Liste der Ereignisse für Amazon Aurora finden Sie unter Amazon RDS-Ereigniskategorien und Ereignisnachrichten für Aurora im Amazon Aurora Aurora-Benutzerhandbuch.

Registerkarte „Dienste aufrufen“
Database Insights zeigt die Dienste und Operationen, die Ihre Instanz aufrufen. Database Insights lässt sich in CloudWatch Application Signals integrieren, um Metriken für jeden Service und Vorgang bereitzustellen, einschließlich Verfügbarkeit, Latenz, Fehler und Volumen.

Analysieren Sie die Datenbankleistung bei Bedarf mit CloudWatch Database Insights
Analysieren Sie die Datenbankleistung mit On-Demand-Analysen für Ihre Amazon RDS-Datenbanken mit CloudWatch Database Insights.
Verwenden Sie die Registerkarte Leistungsanalyse, um Leistungsanalyseberichte für Datenbanken in Ihrer Flotte anzuzeigen.
Informationen zu Leistungsanalyseberichten für Amazon Aurora finden Sie unter Analysieren der Datenbankleistung für einen bestimmten Zeitraum im Amazon Aurora Aurora-Benutzerhandbuch.
Anmerkung
Sie müssen Leistungsanalyseberichte mit der Amazon RDS-Konsole oder API erstellen. AWS CLI Informationen zum Erstellen eines Leistungsanalyseberichts für Amazon Aurora finden Sie unter Erstellen eines Leistungsanalyseberichts in Performance Insights im Amazon Aurora Aurora-Benutzerhandbuch.
Integration von CloudWatch Datenbankeinblicken in CloudWatch Anwendungssignale
Integrieren Sie CloudWatch Datenbankeinblicke mit CloudWatch Anwendungssignalen.
Verwenden Sie die Registerkarte Aufrufdienste, um die Dienste und Operationen von CloudWatch Application Signals anzuzeigen, die einen Endpunkt der ausgewählten Instanz aufgerufen haben. CloudWatch Sortiert die Tabelle standardmäßig nach der Fehlerrate. Wählen Sie Werte in den Spalten Services, Operations oder Endpoint Address aus, um die entsprechende Ressource in der CloudWatch Application Signals Console anzuzeigen.
Weitere Informationen zu unterstützten Systemen für CloudWatch Application Signals finden Sie unterApplication Signals, unterstützte Systeme .