Query profiler
このドキュメントでは、クエリのコンポーネントとパフォーマンスを分析するためのグラフィカルツールである Query profiler について説明します。
Query profiler は、Amazon Redshift コンソールから表示できる、クエリのモニタリングおよびトラブルシューティング機能です。クエリのパフォーマンスを分析するのに役立ちます。主に、クエリに関する実行順序、実行計画、統計を視覚とグラフィックで表示し、それらを理解して、トラブルシューティングを行いやすくすることを目的としています。Query profiler は、次のタイプのクエリコンポーネントを分析するのに役立ちます。
子クエリ - 子クエリは、クエリからの作業の一部です。Amazon Redshift では、効率的であれば、1 つの大きなクエリとして処理する代わりにクエリを複数の子クエリに分割できます。プロファイラーには、それぞれの子クエリのプロパティが表示されます。子クエリは、ストリームと追加のサブコンポーネントで構成されます。
Query profiler が表示する子クエリのタイプには、通常、以下のものが含まれます。
一時テーブルクエリ: この子クエリのテキストは
CREATE TEMP TABLEコマンドで始まります。この子クエリは、処理する他の子クエリの一時テーブルを作成します。統計クエリ: Query profiler では、この子クエリの先頭に次のコメントを追加して、識別しやすくします。
-- collect statistics of child queryqueryIDこの子クエリは、Amazon Redshift クエリエンジンがパフォーマンスを最適化するために使用する情報を収集します。
注記
Query Profiler は、Amazon Redshift が実行する最後の子クエリとしてユーザーが指定するクエリを表示します。
ストリーム - ストリームは、利用可能なコンピューティングノードのスライスにパッケージ化されたセグメントのコレクションです。それぞれの子クエリは、1 つ以上のセグメントで構成されます。Query profiler では、実行時間など、各ストリームのプロパティを確認できます。ストリームのリストを確認すれば、パフォーマンスのボトルネックをすばやく発見できる可能性が高くなります。
セグメント - セグメントは、1 つのプロセスで実行できる複数のステップの組み合わせです。また、セグメントは、コンピューティングノードのスライスによって実行可能な最小コンパイルユニットです。スライスは、Amazon Redshift の並列処理単位です。並行して実行されるストリーム内のセグメント。Query profiler はセグメントをグラフィカルには表示しませんが、そのステップの詳細ペインにあるステップのセグメント情報にアクセスできます。
ステップ - 各セグメントは、ステップのコレクションで構成されます。ステップは、クエリ内の作業の一部です。ステップには、例えば hashjoin や、テーブルからのレコードの読み取りである scan を含めることができます。
ストリーム、セグメント、ステップの詳細については、「Amazon Redshift データベースデベロッパーガイド」の「クエリプランと実行ワークフロー」を参照してください。
Query Profiler には、SYS_QUERY_HISTORY、SYS_QUERY_DETAIL、SYS_QUERY_EXPLAIN、SYS_CHILD_QUERY_TEXT ビューから返される情報が表示されます。これらのビューの詳細については、「Amazon Redshift データベースデベロッパーガイド」の「SYS_QUERY_HISTORY」、「SYS_QUERY_DETAIL」、「SYS_QUERY_EXPLAIN」、「SYS_CHILD_QUERY_TEXT」を参照してください。
Query profiler は、データベースで最近実行されたクエリのクエリ情報のみを表示します。データベースに対して実行するのではなく、事前に読み込まれたキャッシュデータを使用して完了するクエリには、事前に情報が利用できなかった場合、クエリプロファイルは作成されません。これは、Amazon Redshift が上記に対してクエリプランを生成しないためです。
Query Profiler を使用するための前提条件
SYS モニタリングビューは、使いやすく、複雑さを軽減するように設計されており、効果的なモニタリングとトラブルシューティングに役立つさまざまなメトリクスを提供します。SYS モニタリングビューでは、クラスターのサイズやアクティビティに関係なく、過去 7 日分のクエリ履歴も確実に表示されます。ユーザーは自分が実行したクエリしか表示できませんが、スーパーユーザーはすべてのユーザーが実行したクエリを表示できます。
IAM ユーザーアカウントまたはロールには、コンソールの [クエリとデータベースのモニタリング] セクションにアクセスするためのアクセス許可が必要です。このセクションでは、ユーザーアカウントまたはロールにアクセス許可を追加する方法について説明します。
次のポリシーを使用して、IAM ユーザーアカウントまたはロールに最小限のアクセス許可を追加します。
{
    "Version": "2012-10-17",
    "Statement": [
        {
            "Effect": "Allow",
            "Action": [
                "redshift:DescribeClusters",
                "redshift-serverless:ListNamespaces",
                "redshift-serverless:ListWorkgroups",
                "redshift-data:ExecuteStatement",
                "redshift-data:DescribeStatement",
                "redshift-data:GetStatementResult"
            ],
            "Resource": [
                "arn:aws:redshift-serverless:<your-namespace>",
                "arn:aws:redshift-serverless:<your-workgroupname>",
                "arn:aws:redshift:<your-clustername>"
            ]
        }
    ]
}
ロールにクエリモニタリング許可を付与する
sys:monitor アクセス許可を付与されたロールを割り当てられたユーザーは、すべてのクエリを表示できます。sys:operator アクセス許可を付与されたロールを割り当てられたユーザーは、クエリのキャンセル、クエリ履歴の分析、VACUUM オペレーションを実行できます。
ロールにクエリモニタリング許可を付与する
次のコマンドを使用して、システムモニタリングのアクセス権を付与します。
role-nameは、アクセス権を付与する対象ロールの名前です。grant role sys:monitor to "IAMR:role-name";(オプション) 次のコマンドを使用して、システムオペレーターのアクセス権を付与します。
role-nameは、アクセス権を付与する対象ロールの名前です。grant role sys:operator to "IAMR:role-name";
ユーザーにクエリモニタリング許可を付与する
sys:monitor アクセス許可を割り当てられたユーザーは、すべてのクエリを表示できます。sys:operator アクセス許可を割り当てられたユーザーは、クエリのキャンセル、クエリ履歴の分析、VACUUM オペレーションを実行できます。
ユーザーにクエリモニタリング許可を付与する
次のコマンドを使用して、システムモニタリングのアクセス権を付与します。
user-nameは、アクセス権を付与する対象ユーザーの名前です。grant role sys:monitor to "IAMR:user-name";(オプション) 次のコマンドを使用して、システムオペレーターのアクセス権を付与します。
user-nameは、アクセス権を付与する対象ユーザーの名前です。grant role sys:operator to "IAMR:user-name";
Amazon Redshift コンソールで Query profiler にアクセスしてクエリを分析する
Amazon Redshift Serverless またはプロビジョニングされた Amazon Redshift のいずれかの Query Profiler にアクセスできます。詳細については、次のセクションを参照してください。
トピック
Amazon Redshift Serverless の Amazon Redshift コンソールで Query profiler にアクセスする
Amazon Redshift Serverless の Query profiler にアクセスするには、以下を実行します。
Amazon Redshift Serverless コンソールを開きます。
ナビゲーションペインの [モニタリング] で、[クエリとデータベースのモニタリング] を選択します。
[ワークグループ] を選択します。
[クエリとデータベースのモニタリング] を選択します。
[クエリ] を選択します。
[クエリの詳細] ページの [クエリプラン] タブを選択します。
クエリプランが利用可能な場合は、子クエリのリストが表示されます。[クエリ] を選択して、Query profiler で表示します。
Amazon Redshift Provisioned の Amazon Redshift コンソールで Query profiler にアクセスする
Amazon Redshift Provisioned の Query profiler にアクセスするには、以下を実行します。
Amazon Redshift Provisioned のクラスターダッシュボードを開きます。
[クラスター] を選択します。
[Query monitoring] (クエリのモニタリング) を選択します。
データベースに接続します。
[クエリとデータベースのモニタリング] を選択します。
[クエリ] を選択します。
クエリプランが利用可能な場合は、子クエリのリストが表示されます。[クエリ] を選択して、Query profiler で表示します。
Query profiler のユーザーインターフェイス
Query profiler は、次のページを使用してクエリに関する情報を表示します。
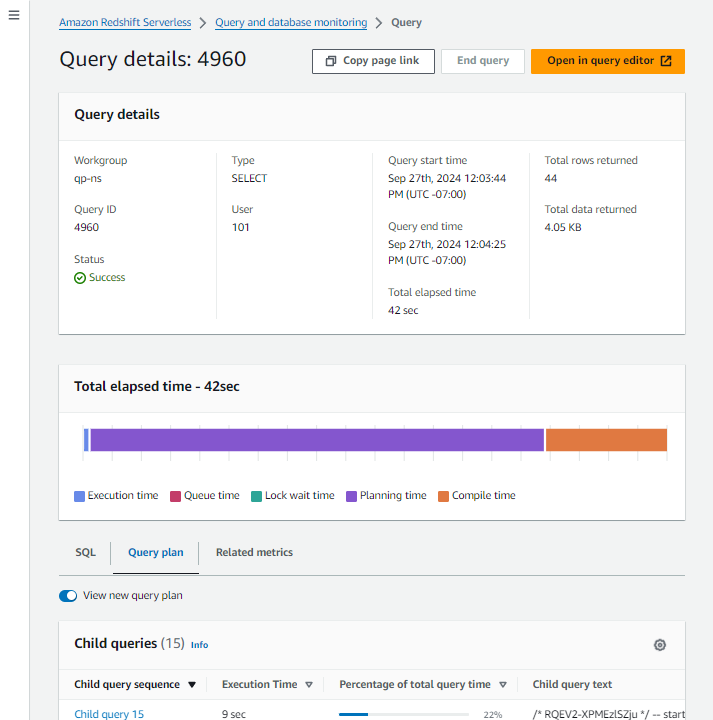
[[クエリの詳細] ページ] - このページには、クエリの統計と子クエリが表示されます。
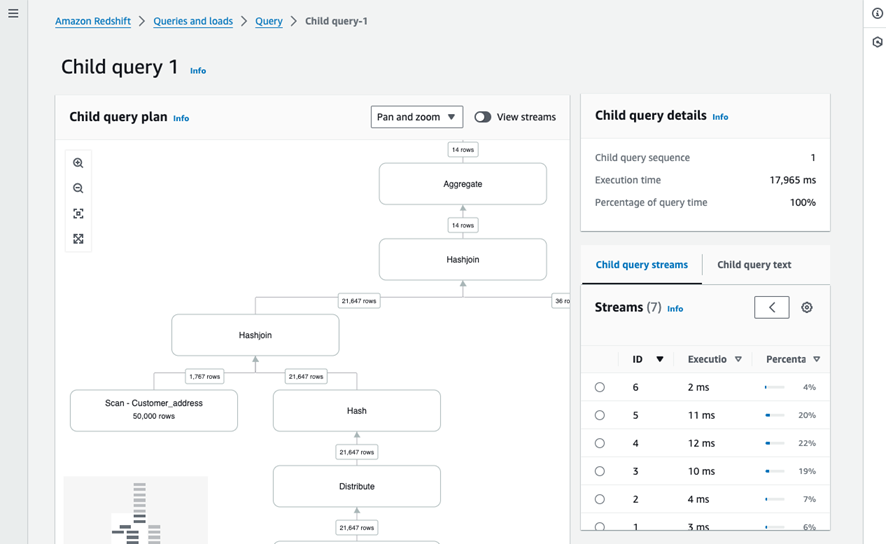
[[子クエリ] ページ] - このページには、子クエリの実行計画の統計、ストリーム、ビジュアル表現が表示されます。このページは、[クエリとデータベースのモニタリング] ページの [子クエリ] リストから [子クエリ] を選択するとコンソールに表示されます。
[クエリの詳細] ページ

[クエリの詳細] ページには、次のコンポーネントがあります。
上部ペイン - ページの上部ペインには、ステータスやタイプなど、クエリの詳細が表示されます。上部ペインに表示される情報のソースについては、「Amazon Redshift データベースデベロッパーガイド」の「SYS_QUERY_HISTORY」を参照してください。
[SQL] タブ - 下部パネルのこのタブには、元のユーザークエリの SQL テキストが表示されます。
[クエリプラン] タブ - 下部パネルのこのタブには、Amazon Redshift がユーザークエリのデータと統計を準備するために使用される子クエリのリストが表示されます。デフォルトでは、[子クエリ] リストには、それぞれの子クエリに関する情報と集計された統計が表示されます。このページに表示される情報のソースについては、「Amazon Redshift データベースデベロッパーガイド」の「SYS_QUERY_DETAIL」を参照してください。
[子クエリ] リストの列を追加または削除するには、[設定] メニューを使用します。
[関連メトリクス] - 下部パネルのこのタブには、クエリの次の CloudWatch メトリクスが表示されます。
[使用した RPU キャパシティー] (サーバーレスワークグループの場合): クエリで使用したコンピューティングキャパシティーで、Redshift 処理ユニット (RPU) で測定されます。詳細については、「Amazon Redshift Serverless 容量を計算する」を参照してください。
[クラスターの健全性ステータス]、[CPU 使用率]、[使用済みのストレージキャパシティー] (プロビジョニングされたクラスターの場合): クエリが使用したステータスとシステムリソースです。
[アクティブなデータベース接続]: クエリの
DatabaseConnectionsメトリクス。
CloudWatch のメトリクスの詳細については、「Amazon Redshift のパフォーマンスデータ」を参照してください。
[子クエリ] ページ

[子クエリ] ページには、次のコンポーネントがあります。
子クエリのプルダウン - このコントロールは、子クエリごとのシーケンス名と実行時間を表示します。このコントロールで子クエリを選択すると、他の子クエリに移動できます。
サイドパネル - このパネルには、子クエリストリームと子クエリテキストを表示するためのタブが含まれています。
[子クエリストリーム] タブ - 上部パネルのこのタブには、以下のものが表示されます。
[ストリーム] - このペインには、子クエリ内のストリームのリストが表示されます。このペインには、Amazon Redshift がクエリの最適化に使用するストリームに関する情報と集計データが表示されます。このペインの詳細については、「Amazon Redshift データベースデベロッパーガイド」の「SYS_QUERY_DETAIL」を参照してください。
[設定] メニューを使用して、[ストリーム] ペインから列を追加または削除できます。[ストリーム] ペインの歯車アイコンを使用して、[設定] メニューにアクセスします。
[子クエリ] ペイン - 子クエリのステップをグラフィカルに表現したものです。[子クエリ] ペインの詳細については、以下の「[子クエリ] ペイン」を参照してください。
[子クエリテキスト] タブ - 上部パネルのこのタブには、子クエリの SQL コードが表示されます。
[子クエリの詳細] ペイン - 右側のパネルのこのペインには、子クエリの詳細が表示されます。このペインの詳細については、「Amazon Redshift データベースデベロッパーガイド」の「SYS_QUERY_DETAIL」を参照してください。
[ストリーム詳細] ペイン - [ストリーム] ペインで [ストリーム] を選択すると、[ストリーム詳細] ペインにストリームに関する情報が表示されます。このパネルの詳細については、「Amazon Redshift データベースデベロッパーガイド」の「SYS_QUERY_DETAIL」を参照してください。
[ステップの詳細] ペイン - [ストリーム] ペインまたは [子クエリプラン] のグラフで [ステップ] を選択すると、[ステップの詳細] ペインにステップに関する情報が表示されます。このペインの詳細については、「Amazon Redshift データベースデベロッパーガイド」の「SYS_QUERY_DETAIL」を参照してください。
[子クエリ] ペイン
Query profiler は、選択した子クエリのステップのグラフィカル表現として、[子クエリ] ペインに子クエリを表示します。
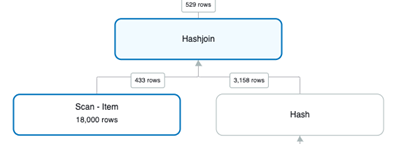
[子クエリ] ペインには、実行順序とステップ間の関係が表示されます。例えば、あるステップが他の 2 つのステップからの出力を結合する場合、[子クエリ] ペインには、そのステップが 2 つのノードから入力されるツリーノードとして表示されます。

デフォルトでは、[子クエリ] ペインにはステップを含むストリームは表示されません。Amazon Redshift が子クエリのステップを論理的にパーティション化するために使用するストリームを表示するには、[ストリームの表示] を選択します。[ストリームの表示] を選択すると、[子クエリ] ペインにクエリのストリームに含まれるステップが表示されます。
[子クエリ] ペインには、セグメント情報は表示されません。ステップのセグメントを表示するには、[ステップ] を選択します。[ステップの詳細] ペインには、ステップのセグメントが表示されます。
[子クエリ] ペインのナビゲーション
[子クエリ] ペインで [ステップ] を選択すると、それらに関する詳細情報を表示できます。また、ワークスペースでパンやズームを行い、クエリプランのステップをより視覚化的に確認できます。
次の方法を使用して、[子クエリ] プランでノード、パン、ズームを選択できます。
マウスの使用 - [ノード]を選択して、ワークスペースをクリックしてドラッグしてパンし、
Ctrl(Windows) またはCMD(Mac) を長押ししてマウスホイールでズームできます。[ノード] を選択すると、ワークスペースをパンおよびズームすることにより、そのノードが強調表示されます。ワークスペースで [ストリーム] を選択すると、そのストリームは[ストリーム] リストで強調表示されます。ワークスペースでステップを選択すると、[ステップの詳細] ペインにそのステップに関する情報が表示されます。ワークスペースの左上にあるズームと画面合わせのコントロールを使用する - これらのコントロールを使用すると、ワークスペース全体に合わせてズームイン、ズームアウト、画面合わせ、全画面表示モードに移行できます。クエリプラン全体に合わせてズームすると、ワークスペースはクエリプランを水平方向と垂直方向の両方にセンタリングします。
ワークスペースの右下にあるミニマップの使用 - ワークスペースの左下隅にあるミニマップコントロールを使用して、ワークスペースのパンまたはズームを行うことができます。
[ストリーム] ペインでストリームを選択する - [ストリーム] ペインで [ストリーム] を選択すると、ワークスペースがパンおよびズームして、選択したストリームを表示し、[ストリームの詳細] ペインにストリームに関する情報を表示します。
[ストリーム詳細] ペインで [ステップ] を選択する - [ストリーム詳細] ペインで [ステップ] を選択すると、ワークスペースをパンおよびズームして選択したステップを表示し、[ステップ詳細] ペインにステップに関する情報を表示します。
注記
ワークスペースまたは別のペインで [ステップ] を選択すると、ワークスペースはズームとパンを試行し、選択したステップが最適に表示されます。
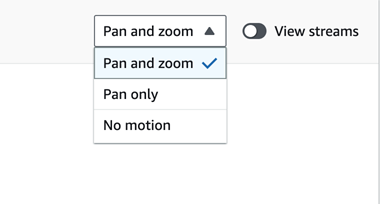
ワークスペースまたは別のペインからストリームまたはステップを選択すると、ワークスペースの右上のコントロールで [パンおよびズーム] を選択した場合のみ、ワークスペースはそのストリームまたはステップにズームおよびパンします。この動作は、プルダウンで適切な設定を選択することにより、パンとズーム、パンのみ、または動作なしに制限できます。

Query profiler を使用したクエリのトラブルシューティング
クエリのトラブルシューティングを行う場合は、[子クエリ] を選択して、[合計クエリ時間の割合] が最も大きいストリームを判断できます。これは、クエリのどの部分を詳細に分析する必要があるかを判断するための簡単な方法です。
最も時間がかかっている子クエリが判明したら、そのステップを表示して、パフォーマンスを低下させている結合やスキャンを確認します。