Asking and answering questions of data with Amazon Q in QuickSight
Note
To view the multi-visual Amazon Q experience, the topic author must do the following: add named entities, and convert an existing topic to use generative capabilities or create a new generative topic. For more information, see Authoring Q&A.
Accelerate data-driven decisions with humanistic Q&A that includes:
AI-generated narrative that highlights key insights
Multi-visual answer that provides the answer to your question along with supporting visuals to add valuable context
Home page for every topic with AI-generated and author-reviewed suggested questions and automated data previews to see what data you can ask about
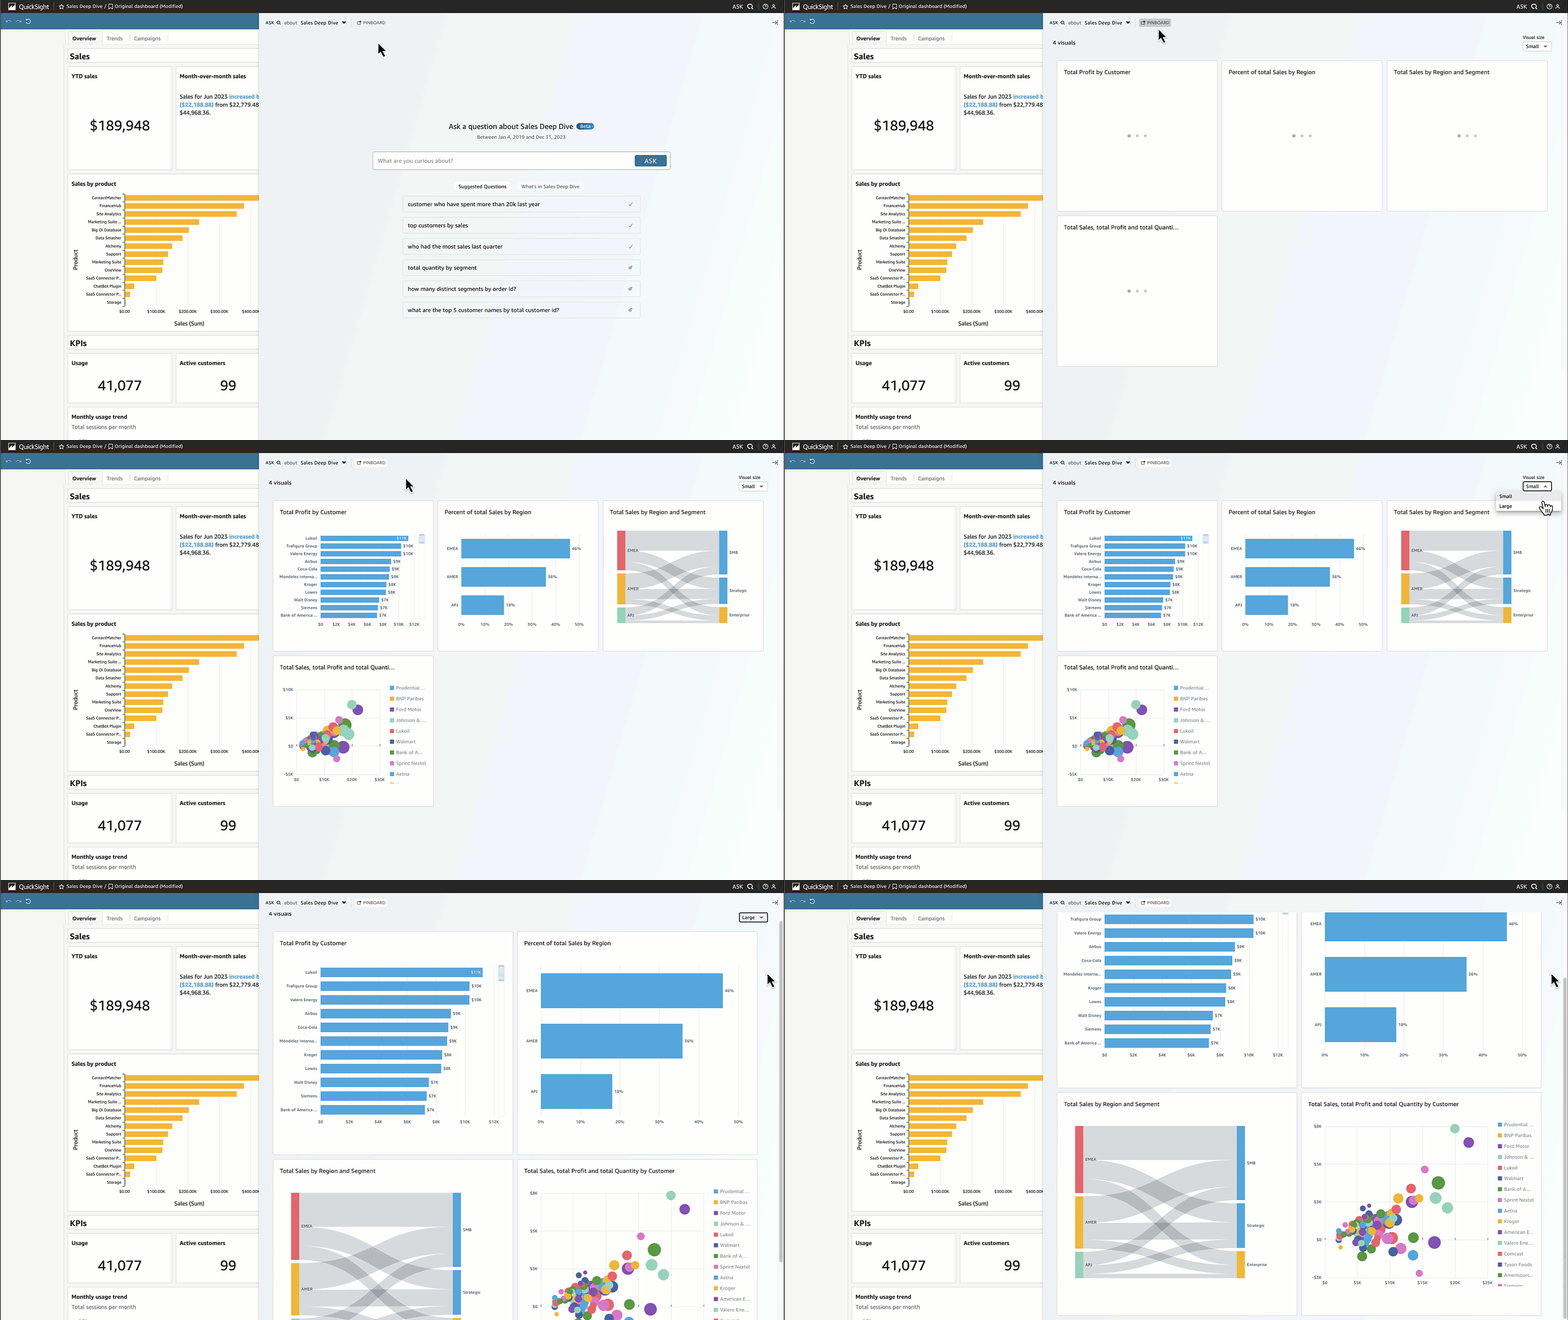
In the top navigation bar, at the top right, choose Ask Q to open Amazon Q. You can also open Amazon Q from the blue bar when a topic is linked to a dashboard. Once you open your topic, there is a home page with a list of suggested questions and What’s in your topic to see what data you can ask about.

When there are multiple dates available, choose more... to view them. For example, in this Student Enrollment Trends topic, there is data available for enrollment data spanning from 2018 to 2023, but there is also student Date of Birth (DOB) data ranging from 1973 to 2005.

Choose a suggested question or type your own question to get started. By hovering over a sentence in the AI-generated narrative, you can clearly identify the source visualization and verify the values. Each visualization is interactive and can be added to your pinboard.

Amazon Q can answer a variety of questions from vague to precise.
If you don’t have a precise question in mind, you can ask a vague question that is only one word or a short phrase, like “sales” or “top students." You can include additional filter criteria with these vague questions like “top students last semester."
Question examples include:
Entity name: “Order Details"
-
Note
You can find the entities from the topic home page and in the What’s in
topictab at the top of the list.
Field name: “Segment”
Field values: “Acme Inc.,” “Washington DC”
Vague (or implicit) filters: “best account managers," “bottom products”
-
For precise questions that Amazon Q supports, see this table of question types: Types of questions supported by Q. Examples include “product with largest WoW growth %” or “forecast sales for APAC customers by quarter.”Amazon Q covers a range of filters, like top/bottom, relative and absolute date filters, period-to-date and period-over-period, and more. Amazon Q also supports analytical questions, like percent of total, or “why did sales drop in October 2023?"
Tip
To help you form questions, think Who, What, Where, When and Why.
Unpacking your answer:
Interpreted as: – This is how Amazon Q interpreted your question. It will map your words to the underlying data so you can verify that Amazon Q correctly understood you. If not, adjust your question or leave feedback for your author.

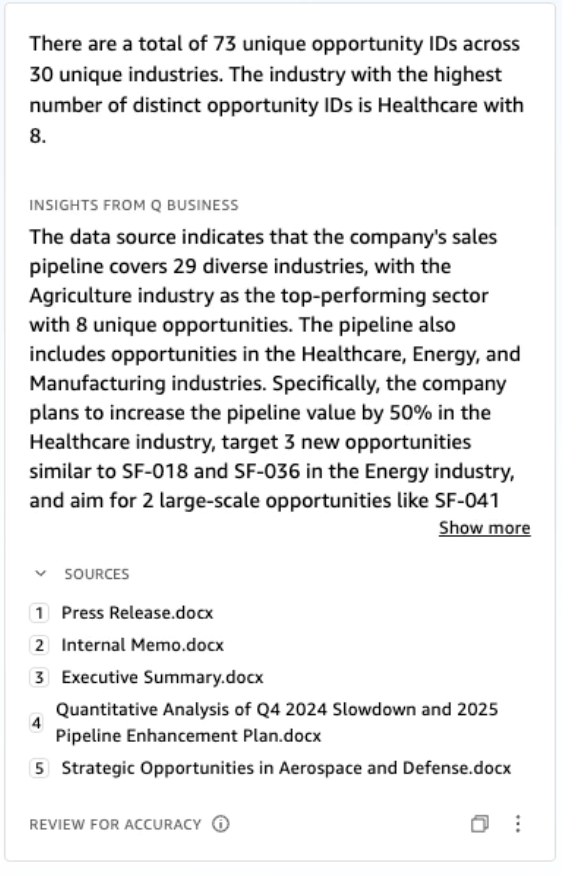
AI-generated narrative: – A summary of the visuals that highlights key insights. If your QuickSight account is connected to an Amazon Q application, you may receive additional insights from unstructured data sources under Insights from Q Business. You can see the unstructured sources that are used in the Sources collabsible. For more information about connecting a QuickSight account to a Amazon Q Business application, see Augmenting Amazon QuickSight insights with Amazon Q Business.

Visuals: – Visuals consist of: center visual that directly answers the question, supporting visual on the right that provides context, relevant KPIs, and a details table at the bottom.
Note
If the field is not included in a named entity, then it will display as a single visual.
Did you mean: – When there are multiple interpretations to your question, Amazon Q will display a list of alternate answers that you can select to align with your intended question.
In the following example, the question "top customers” can be interpreted in several ways, including by “Total Sales,” “Total Profit,” or “number of customers."

Other tips
To re-size the panel, drag the left side.
Add important visuals to your pinboard for quick access. View your pinboard from the top of the Amazon Q pane, as shown following:


Provide feedback for your topic author to see and make improvements.
