本文為英文版的機器翻譯版本,如內容有任何歧義或不一致之處,概以英文版為準。
存取 Sentinel-2 點陣資料集合並建立地球觀測作業,以執行土地分割
此 Python 教學課程使用適用於 Python 的 SDK (Boto3) 和 Amazon SageMaker Studio Classic 筆記本。若要成功完成此示範,請確定您具有使用 SageMaker 地理空間和 Studio Classic 所需的 AWS Identity and Access Management (IAM) 許可。SageMaker 地理空間需要您擁有可存取 Studio Classic 的使用者、群組或角色。您也必須在其信任政策sagemaker-geospatial.amazonaws.com中具有指定 SageMaker 地理空間服務主體的 SageMaker AI 執行角色。
若要進一步了解這些需求,請參閱 SageMaker 地理空間 IAM 角色。
本教學課程說明如何使用 SageMaker 地理空間 API 完成下列作業:
-
使用
list_raster_data_collections尋找可用的點陣式資料集合。 -
使用
search_raster_data_collection搜尋指定的點陣式資料集合。 -
使用
start_earth_observation_job建立地球觀測工作 (EOJ)。
用 list_raster_data_collections 來尋找可用的資料集合
SageMaker 地理空間支援多個點陣式資料集合。若要進一步了解可用的資料集合,請參閱資料集合。
此示範使用從 Sentinel-2 雲端最佳化 GeoTiff
若要搜尋感興趣的區域 (AOI),您需要與 Sentinel-2 衛星資料相關聯的 ARN。若要在 中尋找可用的資料收集及其相關聯的 ARNs AWS 區域,請使用 list_raster_data_collections API 操作。
由於回應可以分頁,因此必須使用 get_paginator 作業傳回所有相關資料:
import boto3
import sagemaker
import sagemaker_geospatial_map
import json

## SageMaker Geospatial  is currently only avaialable in US-WEST-2
session = boto3.Session(region_name='us-west-2')
execution_role = sagemaker.get_execution_role()

## Creates a SageMaker Geospatial client instance
geospatial_client = session.client(service_name="sagemaker-geospatial")

# Creates a resusable Paginator for the list_raster_data_collections API operation
paginator = geospatial_client.get_paginator("list_raster_data_collections")

# Create a PageIterator from the paginator class
page_iterator = paginator.paginate()

# Use the iterator to iterate throught the results of list_raster_data_collections
results = []
for page in page_iterator:
    results.append(page['RasterDataCollectionSummaries'])

print(results)
這是來自 list_raster_data_collections API 作業的 JSON 的回應範例。它被截斷以僅包含在此程式碼範例中使用的資料集合 (Sentinel-2)。如需有關特定點陣式資料集合的更多詳細資訊,請使用 get_raster_data_collection:
{
    "Arn": "arn:aws:sagemaker-geospatial:us-west-2:378778860802:raster-data-collection/public/nmqj48dcu3g7ayw8",
    "Description": "Sentinel-2a and Sentinel-2b imagery, processed to Level 2A (Surface Reflectance) and converted to Cloud-Optimized GeoTIFFs",
    "DescriptionPageUrl": "https://registry.opendata.aws/sentinel-2-l2a-cogs",
    "Name": "Sentinel 2 L2A COGs",
    "SupportedFilters": [
        {
            "Maximum": 100,
            "Minimum": 0,
            "Name": "EoCloudCover",
            "Type": "number"
        },
        {
            "Maximum": 90,
            "Minimum": 0,
            "Name": "ViewOffNadir",
            "Type": "number"
        },
        {
            "Name": "Platform",
            "Type": "string"
        }
    ],
    "Tags": {},
    "Type": "PUBLIC"
}
執行前一個程式碼範例之後,您會取得 Sentinel-2 點陣式資料集合的 ARN,arn:aws:sagemaker-geospatial:us-west-2:378778860802:raster-data-collection/public/nmqj48dcu3g7ayw8。在下一節中,您可以使用 search_raster_data_collection API 查詢 Sentinel-2 資料收集。
使用 search_raster_data_collection 搜尋 Sentinel-2 點陣式資料集合
在前面區段中,您用 list_raster_data_collections 來取得 Sentinel-2 資料集合的 ARN。現在您可以使用該 ARN 來搜尋指定感興趣區域 (AOI)、時間範圍、屬性和可用紫外線帶的資料集合。
要呼叫 search_raster_data_collection API,您必須將 Python 字典傳遞給 RasterDataCollectionQuery 參數。此範例使用 AreaOfInterest、TimeRangeFilter、PropertyFilters 跟 BandFilter。為了方便起見,您可以使用變數 search_rdc_query 指定 Python 字典來保留搜尋查詢參數:
search_rdc_query = { "AreaOfInterest": { "AreaOfInterestGeometry": { "PolygonGeometry": { "Coordinates": [ [ # coordinates are input as longitute followed by latitude[-114.529, 36.142],[-114.373, 36.142],[-114.373, 36.411],[-114.529, 36.411],[-114.529, 36.142], ] ] } } }, "TimeRangeFilter": { "StartTime":"2022-01-01T00:00:00Z", "EndTime":"2022-07-10T23:59:59Z"}, "PropertyFilters": { "Properties": [ { "Property": { "EoCloudCover": { "LowerBound": 0, "UpperBound": 1 } } } ], "LogicalOperator": "AND" }, "BandFilter": ["visual"] }
在此範例中,您會查詢包含猶他州 Lake MeadAreaOfInterest。此外 Sentinel-2 支援多個類型的影像帶。要測量水面的變化,你只需要 visual 帶。
建立查詢參數之後,您可以使用 search_raster_data_collection API 提出請求。
下列程式碼範例會實作 search_raster_data_collection API 請求。此 API 不支援使用 get_paginator API 進行分頁。為了確保已收集完整的 API 回應,程式碼範例使用 while 迴路來檢查是否 NextToken 存在。然後程式碼範例會使用 .extend() 將衛星影像 URL 和其他回應中繼資料連接至 items_list。
若要進一步了解 search_raster_data_collection,請參閱《Amazon SageMaker AI API 參考》中的 SearchRasterDataCollection。
search_rdc_response = sm_geo_client.search_raster_data_collection(
    Arn='arn:aws:sagemaker-geospatial:us-west-2:378778860802:raster-data-collection/public/nmqj48dcu3g7ayw8',
    RasterDataCollectionQuery=search_rdc_query
)


## items_list is the response from the API request.
items_list = []

## Use the python .get() method to check that the 'NextToken' exists, if null returns None breaking the while loop
while search_rdc_response.get('NextToken'):
    items_list.extend(search_rdc_response['Items'])
    search_rdc_response = sm_geo_client.search_raster_data_collection(
        Arn='arn:aws:sagemaker-geospatial:us-west-2:378778860802:raster-data-collection/public/nmqj48dcu3g7ayw8',
        RasterDataCollectionQuery=search_rdc_query, NextToken=search_rdc_response['NextToken']
    )

## Print the number of observation return based on the query
print (len(items_list))
以下是查詢的 JSON 的回應。為保持清晰起見,已被截斷。在 Assets 鍵值對中僅會傳回請求中指定的 "BandFilter": ["visual"]:
{ 'Assets': { 'visual': { 'Href': 'https://sentinel-cogs.s3.us-west-2.amazonaws.com/sentinel-s2-l2a-cogs/15/T/UH/2022/6/S2A_15TUH_20220623_0_L2A/TCI.tif' } }, 'DateTime': datetime.datetime(2022, 6, 23, 17, 22, 5, 926000, tzinfo = tzlocal()), 'Geometry': { 'Coordinates': [ [[-114.529, 36.142],[-114.373, 36.142],[-114.373, 36.411],[-114.529, 36.411],[-114.529, 36.142], ] ], 'Type': 'Polygon' }, 'Id': 'S2A_15TUH_20220623_0_L2A', 'Properties': { 'EoCloudCover': 0.046519, 'Platform': 'sentinel-2a' } }
現在您有了查詢結果,在下一節中可以使用 matplotlib 來視覺化結果。這是為了驗證結果來自正確的地理區域。
使用 matplotlib 視覺化您的 search_raster_data_collection
在開始地球觀測作業 (EOJ) 之前,您可以搭配使用我們的查詢與 matplotlib 來視覺化結果。下列程式碼範例會從前一個程式碼範例中建立的 items_list 變數取得第一個項目 items_list[0]["Assets"]["visual"]["Href"],並使用 matplotlib 列印影像。
# Visualize an example image.
import os
from urllib import request
import tifffile
import matplotlib.pyplot as plt

image_dir = "./images/lake_mead"
os.makedirs(image_dir, exist_ok=True)

image_dir = "./images/lake_mead"
os.makedirs(image_dir, exist_ok=True)

image_url = items_list[0]["Assets"]["visual"]["Href"]
img_id = image_url.split("/")[-2]
path_to_image = image_dir + "/" + img_id + "_TCI.tif"
response = request.urlretrieve(image_url, path_to_image)
print("Downloaded image: " + img_id)

tci = tifffile.imread(path_to_image)
plt.figure(figsize=(6, 6))
plt.imshow(tci)
plt.show()
在檢查結果是否位於正確的地理區域後,您可以在後續步驟中啟動地球觀測工作 (EOJ)。您可以使用 EOJ 透過使用稱為土地分割的程序,從衛星影像中識別水體。
開始對一系列衛星影像執行土地分割的地球觀測工作 (EOJ)
SageMaker 地理空間提供多個預先訓練的模型,您可以使用這些模型來處理點陣資料集合中的地理空間資料。若要進一步了解可用的預先訓練模型和自訂操作,請參閱作業類型。
要計算水面積的變化,您需要識別影像中的哪些像素對應到水。土地覆蓋分割是由 start_earth_observation_job API 支援的語意分割模型。語意分割模型會將標籤與每個影像中的每個像素產生關聯。在結果中,每個像素都會根據模型的類別地圖指派一個標籤。以下是土地分割模型的類別地圖:
{
    0: "No_data",
    1: "Saturated_or_defective",
    2: "Dark_area_pixels",
    3: "Cloud_shadows",
    4: "Vegetation",
    5: "Not_vegetated",
    6: "Water",
    7: "Unclassified",
    8: "Cloud_medium_probability",
    9: "Cloud_high_probability",
    10: "Thin_cirrus",
    11: "Snow_ice"
}
若要開始地球觀測工作,請使用 start_earth_observation_job API。當您提交請求時,您必須指定下列項目:
-
InputConfig(dict) - 用於指定要搜尋的區域的坐標,以及與您的搜尋相關聯的其他中繼資料。 -
JobConfig(dict) – 用於指定您對資料執行的 EOJ 操作類型。此範例使用LandCoverSegmentationConfig。 -
ExecutionRoleArn(字串) – SageMaker AI 執行角色的 ARN,具有執行任務所需的許可。 -
Name(string) – 地球觀測工作的名稱。
InputConfig 是一個 Python 字典。使用下列變數 eoj_input_config 來保留搜尋查詢參數。當您提出 start_earth_observation_job API 請求時,請使用此變數。
# Perform land cover segmentation on images returned from the Sentinel-2 dataset. eoj_input_config = { "RasterDataCollectionQuery": { "RasterDataCollectionArn": "arn:aws:sagemaker-geospatial:us-west-2:378778860802:raster-data-collection/public/nmqj48dcu3g7ayw8", "AreaOfInterest": { "AreaOfInterestGeometry": { "PolygonGeometry": { "Coordinates":[ [[-114.529, 36.142],[-114.373, 36.142],[-114.373, 36.411],[-114.529, 36.411],[-114.529, 36.142], ] ] } } }, "TimeRangeFilter": { "StartTime":"2021-01-01T00:00:00Z", "EndTime":"2022-07-10T23:59:59Z", }, "PropertyFilters": { "Properties": [{"Property": {"EoCloudCover": {"LowerBound": 0, "UpperBound": 1}}}], "LogicalOperator": "AND", }, } }
JobConfig 是一個 Python 字典,用於指定要對資料執行的 EOJ 作業:
eoj_config = {"LandCoverSegmentationConfig": {}}
既然已經指定字典元素,您可以使用下列程式碼範例提交 start_earth_observation_job API 請求:
# Gets the execution role arn associated with current notebook instance
execution_role_arn = sagemaker.get_execution_role()

# Starts an earth observation job
response = sm_geo_client.start_earth_observation_job(
    Name="lake-mead-landcover",
    InputConfig=eoj_input_config,
    JobConfig=eoj_config,
    ExecutionRoleArn=execution_role_arn,
)

print(response)
開始地球觀測工作會傳回 ARN 以及其他中繼資料。
若要取得所有進行中和目前的地球觀測任務清單,請使用 list_earth_observation_jobs API。若要監控單一地球觀測任務的狀態,請使用 get_earth_observation_job API。要提出此請求,請使用在提交 EOJ 請求後建立的 ARN。若要進一步了解,請參閱 Amazon SageMaker AI API 參考中的 GetEarthObservationJob。
要尋找與 EOJ 相關聯的 ARN,請使用 list_earth_observation_jobs API 作業。若要進一步了解,請參閱《Amazon SageMaker AI API 參考》中的 ListEarthObservationJobs。
# List all jobs in the account
sg_client.list_earth_observation_jobs()["EarthObservationJobSummaries"]
以下是範例 JSON 的回應:
{ 'Arn': 'arn:aws:sagemaker-geospatial:us-west-2:111122223333:earth-observation-job/futg3vuq935t', 'CreationTime': datetime.datetime(2023, 10, 19, 4, 33, 54, 21481, tzinfo = tzlocal()), 'DurationInSeconds': 3493, 'Name':'lake-mead-landcover', 'OperationType': 'LAND_COVER_SEGMENTATION', 'Status': 'COMPLETED', 'Tags': {} }, { 'Arn': 'arn:aws:sagemaker-geospatial:us-west-2:111122223333:earth-observation-job/wu8j9x42zw3d', 'CreationTime': datetime.datetime(2023, 10, 20, 0, 3, 27, 270920, tzinfo = tzlocal()), 'DurationInSeconds': 1, 'Name':'mt-shasta-landcover', 'OperationType': 'LAND_COVER_SEGMENTATION', 'Status': 'INITIALIZING', 'Tags': {} }
EOJ 工作狀態變更為 COMPLETED 後,繼續執行下一節以計算 Lake Mead's 表面積的變更。
計算 Lake Mead 表面積的變化
要計算 Lake Mead 表面積的變化,請先使用 export_earth_observation_job 將 EOJ 的結果匯出至 Amazon S3:
sagemaker_session = sagemaker.Session() s3_bucket_name = sagemaker_session.default_bucket() # Replace with your own bucket if needed s3_bucket = session.resource("s3").Bucket(s3_bucket_name) prefix ="export-lake-mead-eoj"# Replace with the S3 prefix desired export_bucket_and_key = f"s3://{s3_bucket_name}/{prefix}/" eoj_output_config = {"S3Data": {"S3Uri": export_bucket_and_key}} export_response = sm_geo_client.export_earth_observation_job( Arn="arn:aws:sagemaker-geospatial:us-west-2:111122223333:earth-observation-job/7xgwzijebynp", ExecutionRoleArn=execution_role_arn, OutputConfig=eoj_output_config, ExportSourceImages=False, )
若要檢視匯出任務的狀態,請使用 get_earth_observation_job:
export_job_details = sm_geo_client.get_earth_observation_job(Arn=export_response["Arn"])
若要計算 Lake Mead 水位的變化,請將土地遮罩下載到本機 SageMaker 筆記本執行個體,並從我們上一個查詢中下載來源映像。在土地分割模型的分類地圖中,水的等級索引為 6。
要從 Sentinel-2 影像中映像水遮罩,請遵循下列步驟。首先計算影像中標記為水 (類別索引 6) 的像素數目。其次,將計數乘以每個像素覆蓋的區域。頻帶在其空間解析度可能有所不同。針對土地覆蓋分割模型,所有頻帶都將降縮小抽樣取樣至等於 60 公尺的空間解析度。
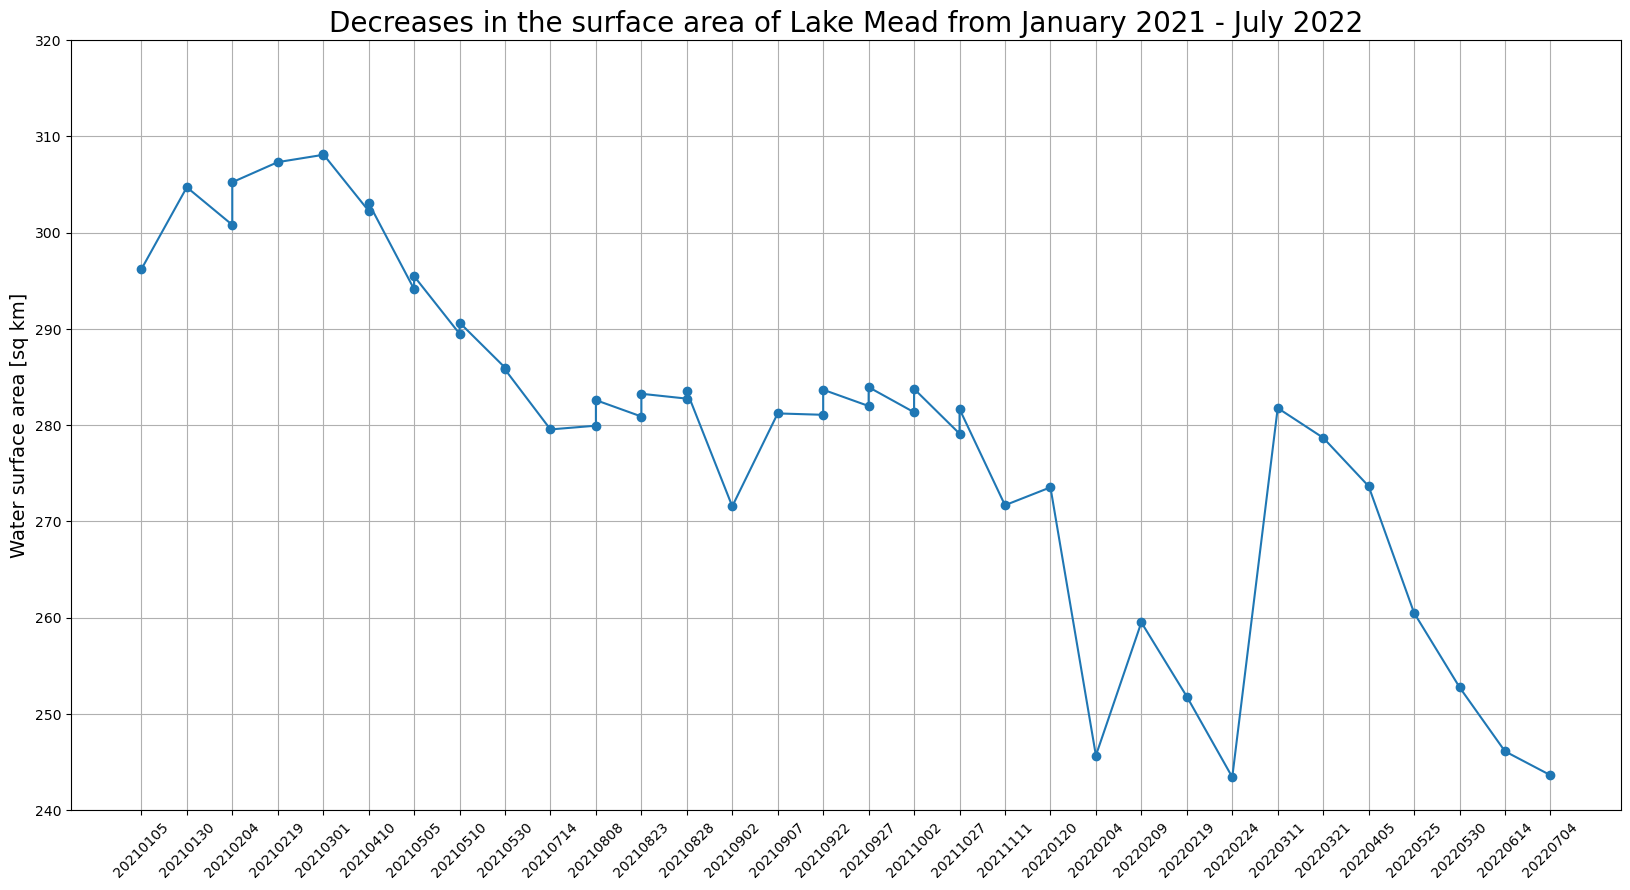
import os
from glob import glob
import cv2
import numpy as np
import tifffile
import matplotlib.pyplot as plt
from urllib.parse import urlparse
from botocore import UNSIGNED
from botocore.config import Config

# Download land cover masks
mask_dir = "./masks/lake_mead"
os.makedirs(mask_dir, exist_ok=True)
image_paths = []
for s3_object in s3_bucket.objects.filter(Prefix=prefix).all():
    path, filename = os.path.split(s3_object.key)
    if "output" in path:
        mask_name = mask_dir + "/" + filename
        s3_bucket.download_file(s3_object.key, mask_name)
        print("Downloaded mask: " + mask_name)

# Download source images for visualization
for tci_url in tci_urls:
    url_parts = urlparse(tci_url)
    img_id = url_parts.path.split("/")[-2]
    tci_download_path = image_dir + "/" + img_id + "_TCI.tif"
    cogs_bucket = session.resource(
        "s3", config=Config(signature_version=UNSIGNED, region_name="us-west-2")
    ).Bucket(url_parts.hostname.split(".")[0])
    cogs_bucket.download_file(url_parts.path[1:], tci_download_path)
    print("Downloaded image: " + img_id)

print("Downloads complete.")

image_files = glob("images/lake_mead/*.tif")
mask_files = glob("masks/lake_mead/*.tif")
image_files.sort(key=lambda x: x.split("SQA_")[1])
mask_files.sort(key=lambda x: x.split("SQA_")[1])
overlay_dir = "./masks/lake_mead_overlay"
os.makedirs(overlay_dir, exist_ok=True)
lake_areas = []
mask_dates = []

for image_file, mask_file in zip(image_files, mask_files):
    image_id = image_file.split("/")[-1].split("_TCI")[0]
    mask_id = mask_file.split("/")[-1].split(".tif")[0]
    mask_date = mask_id.split("_")[2]
    mask_dates.append(mask_date)
    assert image_id == mask_id
    image = tifffile.imread(image_file)
    image_ds = cv2.resize(image, (1830, 1830), interpolation=cv2.INTER_LINEAR)
    mask = tifffile.imread(mask_file)
    water_mask = np.isin(mask, [6]).astype(np.uint8)  # water has a class index 6
    lake_mask = water_mask[1000:, :1100]
    lake_area = lake_mask.sum() * 60 * 60 / (1000 * 1000)  # calculate the surface area
    lake_areas.append(lake_area)
    contour, _ = cv2.findContours(water_mask, cv2.RETR_TREE, cv2.CHAIN_APPROX_SIMPLE)
    combined = cv2.drawContours(image_ds, contour, -1, (255, 0, 0), 4)
    lake_crop = combined[1000:, :1100]
    cv2.putText(lake_crop, f"{mask_date}", (10,50), cv2.FONT_HERSHEY_SIMPLEX, 1.5, (0, 0, 0), 3, cv2.LINE_AA)
    cv2.putText(lake_crop, f"{lake_area} [sq km]", (10,100), cv2.FONT_HERSHEY_SIMPLEX, 1.5, (0, 0, 0), 3, cv2.LINE_AA)
    overlay_file = overlay_dir + '/' + mask_date + '.png'
    cv2.imwrite(overlay_file, cv2.cvtColor(lake_crop, cv2.COLOR_RGB2BGR))

# Plot water surface area vs. time.
plt.figure(figsize=(20,10))
plt.title('Lake Mead surface area for the 2021.02 - 2022.07 period.', fontsize=20)
plt.xticks(rotation=45)
plt.ylabel('Water surface area [sq km]', fontsize=14)
plt.plot(mask_dates, lake_areas, marker='o')
plt.grid('on')
plt.ylim(240, 320)
for i, v in enumerate(lake_areas):
    plt.text(i, v+2, "%d" %v, ha='center')
plt.show()
您可以使用 matplotlib 以圖表視覺化結果。該圖表顯示,從 2021 年 1 月至 2022 年 7 月,Lake Mead 的表面積有所下降。