Select your cookie preferences

We use essential cookies and similar tools that are necessary to provide our site and services. We use performance cookies to collect anonymous statistics, so we can understand how customers use our site and make improvements. Essential cookies cannot be deactivated, but you can choose “Customize” or “Decline” to decline performance cookies.

If you agree, AWS and approved third parties will also use cookies to provide useful site features, remember your preferences, and display relevant content, including relevant advertising. To accept or decline all non-essential cookies, choose “Accept” or “Decline.” To make more detailed choices, choose “Customize.”

How to add a line to a static map

Focus mode
How to add a line to a static map - Amazon Location Service

In this topic, you'll learn how to add a line to a static map using Amazon Location Service. We'll cover the supported styling options, how to define a line using GeoJSON, and how to apply custom styles such as color, width, and outline. We'll also explore how to use different measurement units for properties like line width.

Supported styling

Name

Type

Default

Description

color

Color

style-dependent

The line color.

width

Integer/String

2

The line width. For more information, see How to add a line to a static map.

outline-color

Color

style-dependent

The line outline color.

outline-width

Integer/String

0 (turned off)

The width of the outline. For more information, see How to add a line to a static map.

Supported unit

Unit

Description

Integer, for example, 5

Pixels

String with no unit, for example "5"

Pixels

"px"

Pixels

"m"

Meters

"km"

Kilometers

"mi"

Miles

"ft"

Feet

"yd"

Yards

"%"

The percentage of the default value for a specific property, in pixels. For example, if the default value for width is 2 pixels, then 200% is 4 pixels. % is a sensitive character that must be encoded in the request URL as %25.

Add a line

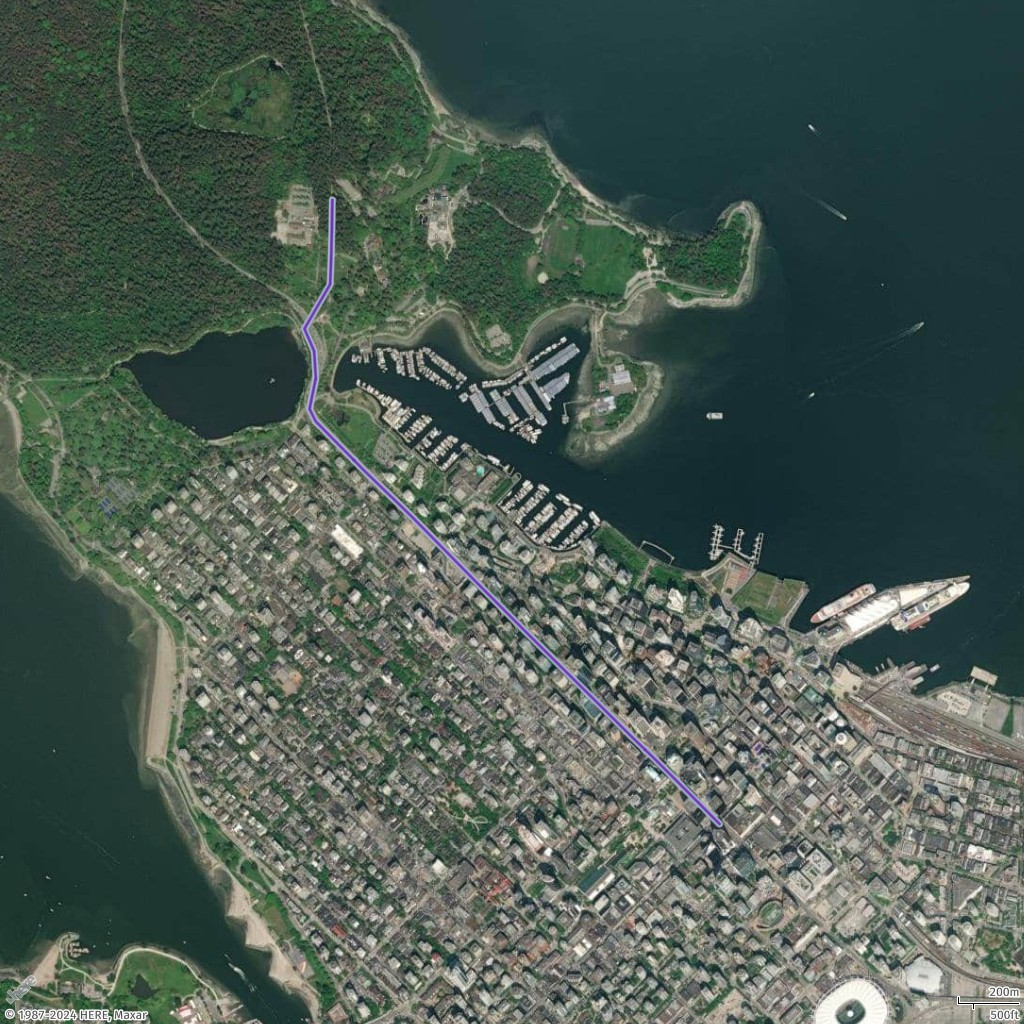
In this example, you will add a line from a place in Vancouver to Stanley Park. The line is created using a GeoJSON format with defined coordinates.

Request
{ "type": "FeatureCollection", "features": [ { "type": "Feature", "geometry": { "type": "LineString", "coordinates": [ [-123.11813, 49.28246], [-123.11967, 49.28347], [-123.12108, 49.28439], [-123.12216, 49.28507], [-123.12688, 49.28812], [-123.1292, 49.28964], [-123.13216, 49.2916], [-123.13424, 49.29291], [-123.13649, 49.2944], [-123.13678, 49.29477], [-123.13649, 49.29569], [-123.13657, 49.29649], [-123.13701, 49.29715], [-123.13584, 49.29847], [-123.13579, 49.29935], [-123.13576, 49.30018], [-123.13574, 49.30097] ] }, "properties": { "name": "To Stanley Park", "description": "An evening walk to Stanley Park." } } ] }
Request URL
https://maps.geo.eu-central-1.amazonaws.com/v2/static/map?style=Satellite&width=1024&height=1024&padding=200&scale-unit=KilometersMiles&geojson-overlay=%7B%22type%22%3A%22FeatureCollection%22,%22features%22%3A%5B%7B%22type%22%3A%22Feature%22,%22geometry%22%3A%7B%22type%22%3A%22LineString%22,%22coordinates%22%3A%5B%5B-123.11813,49.28246%5D,%5B-123.11967,49.28347%5D,%5B-123.12108,49.28439%5D,%5B-123.12216,49.28507%5D,%5B-123.12688,49.28812%5D,%5B-123.1292,49.28964%5D,%5B-123.13216,49.2916%5D,%5B-123.13424,49.29291%5D,%5B-123.13649,49.2944%5D,%5B-123.13678,49.29477%5D,%5B-123.13649,49.29569%5D,%5B-123.13657,49.29649%5D,%5B-123.13701,49.29715%5D,%5B-123.13584,49.29847%5D,%5B-123.13579,49.29935%5D,%5B-123.13576,49.30018%5D,%5B-123.13574,49.30097%5D%5D%7D,%22properties%22%3A%7B%22name%22%3A%22To%20Stanley%20Park%22,%22description%22%3A%22An%20evening%20walk%20to%20Stanley%20Park.%22%7D%7D%5D%7D&key=API_KEY
Response image
Aerial view of coastal city with dense urban area, marina, and surrounding forests.
{ "type": "FeatureCollection", "features": [ { "type": "Feature", "geometry": { "type": "LineString", "coordinates": [ [-123.11813, 49.28246], [-123.11967, 49.28347], [-123.12108, 49.28439], [-123.12216, 49.28507], [-123.12688, 49.28812], [-123.1292, 49.28964], [-123.13216, 49.2916], [-123.13424, 49.29291], [-123.13649, 49.2944], [-123.13678, 49.29477], [-123.13649, 49.29569], [-123.13657, 49.29649], [-123.13701, 49.29715], [-123.13584, 49.29847], [-123.13579, 49.29935], [-123.13576, 49.30018], [-123.13574, 49.30097] ] }, "properties": { "name": "To Stanley Park", "description": "An evening walk to Stanley Park." } } ] }

Add styling to the line

In this example, you will style the line added in the previous example. This includes defining the line's color, width, outline color, and outline width to customize the visual appearance of the line on the map.

Request
{ "type": "FeatureCollection", "features": [ { "type": "Feature", "geometry": { "type": "LineString", "coordinates": [ [-123.11813, 49.28246], [-123.11967, 49.28347], [-123.12108, 49.28439], [-123.12216, 49.28507], [-123.12688, 49.28812], [-123.1292, 49.28964], [-123.13216, 49.2916], [-123.13424, 49.29291], [-123.13649, 49.2944], [-123.13678, 49.29477], [-123.13649, 49.29569], [-123.13657, 49.29649], [-123.13701, 49.29715], [-123.13584, 49.29847], [-123.13579, 49.29935], [-123.13576, 49.30018], [-123.13574, 49.30097] ] }, "properties": { "color": "#6d34b3", "width": "9m", "outline-color": "#a8b9cc", "outline-width": "2px" } } ] }
Request URL
https://maps.geo.eu-central-1.amazonaws.com/v2/static/map?style=Satellite&width=1024&height=1024&padding=200&scale-unit=KilometersMiles&geojson-overlay=%7B%22type%22%3A%22FeatureCollection%22,%22features%22%3A%5B%7B%22type%22%3A%22Feature%22,%22geometry%22%3A%22LineString%22,%22coordinates%22%3A%5B%5B-123.11813,49.28246%5D,%5B-123.11967,49.28347%5D,%5B-123.12108,49.28439%5D,%5B-123.12216,49.28507%5D,%5B-123.12688,49.28812%5D,%5B-123.1292,49.28964%5D,%5B-123.13216,49.2916%5D,%5B-123.13424,49.29291%5D,%5B-123.13649,49.2944%5D,%5B-123.13678,49.29477%5D,%5B-123.13649,49.29569%5D,%5B-123.13657,49.29649%5D,%5B-123.13701,49.29715%5D,%5B-123.13584,49.29847%5D,%5B-123.13579,49.29935%5D,%5B-123.13576,49.30018%5D,%5B-123.13574,49.30097%5D%5D%7D,%22properties%22%3A%7B%22color%22%3A%22%236d34b3%22,%22width%22%3A%229m%22,%22outline-color%22%3A%22%23a8b9cc%22,%22outline-width%22%3A%222px%22%7D%7D%5D%7D&key=API_KEY
Response image
Aerial view of coastal city with dense urban area, marina, and surrounding forests.
{ "type": "FeatureCollection", "features": [ { "type": "Feature", "geometry": { "type": "LineString", "coordinates": [ [-123.11813, 49.28246], [-123.11967, 49.28347], [-123.12108, 49.28439], [-123.12216, 49.28507], [-123.12688, 49.28812], [-123.1292, 49.28964], [-123.13216, 49.2916], [-123.13424, 49.29291], [-123.13649, 49.2944], [-123.13678, 49.29477], [-123.13649, 49.29569], [-123.13657, 49.29649], [-123.13701, 49.29715], [-123.13584, 49.29847], [-123.13579, 49.29935], [-123.13576, 49.30018], [-123.13574, 49.30097] ] }, "properties": { "color": "#6d34b3", "width": "9m", "outline-color": "#a8b9cc", "outline-width": "2px" } } ] }
PrivacySite termsCookie preferences
© 2025, Amazon Web Services, Inc. or its affiliates. All rights reserved.