Overview: a summary of your bot performance
The overview page summarizes your bot’s performance on conversations, utterance recognition, and intent usage. The overview consists of the following sections:
Conversation performance
Use this chart to track the number and percentage of conversations that are categorized as a success, failed, and dropped. To access a list of conversations, select View all conversations to reveal a dropdown menu. You can choose to view a list of all user conversations with the bot or filter for conversations with a specific result (success, failed, or dropped). These links take you to the Conversations subsection of the Conversation dashboard. For more information, see Conversations.
To reveal a box with the count and percentage of conversations with that result, hover over a segment of the chart, as in the following image.

Utterance recognition rate
Use this chart to track the number and percentage of utterances that were detected and missed by your bot. To access a list of utterances, select View utterances to reveal a dropdown menu. You can choose to view a list of all user utterances or filter for utterances with a specific result (missed or detected). These links take you to the Utterance recognition subsection of the Performance dashboard. For more information, see View Utterances to navigate to Utterance recognition.
To reveal a box with the count and percentage of utterances, hover over a segment of the chart, as seen in the following image.

Conversation performance history
Use this graph to track the percentage of conversations categorized as a success, failed, and dropped over the time range that you set in the filters. To see the percentage of conversations with a specific result in an interval of time, hover over that interval, as in the following image.

Top 5 used intents
Use this chart to identify the top five intents that customers used with your bot. Hover over a bar to see the number of times that your bot recognized that intent, as in the following image.

Select View all intents to navigate to the Intents performance subsection of the Performance dashboard, where you can view metrics for your bot’s performance in fulfilling intents. For more information, see Intent performance.
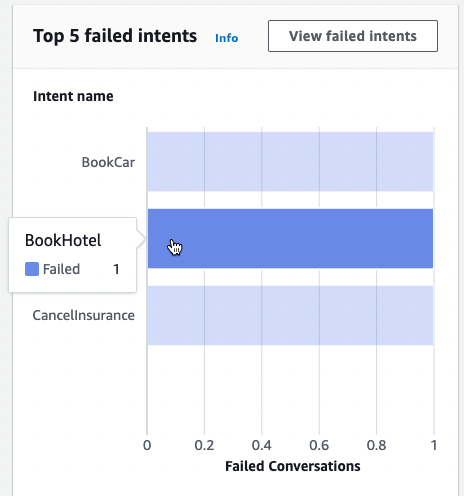
Top 5 failed intents
Use this chart to identify the top five intents that your bot failed to fulfill (see Intents for the definition of a failed intent). Hover over a bar to see the number of times that your bot failed to fulfill that intent, as in the following image.
Select View failed intents to navigate to the Intents performance subsection of the Performance dashboard, where you can view metrics for the intents that your bot failed to fulfill. For more information, see Intent performance.
