翻訳は機械翻訳により提供されています。提供された翻訳内容と英語版の間で齟齬、不一致または矛盾がある場合、英語版が優先します。
ピボットテーブルの計算では、次の関数を使用できます。
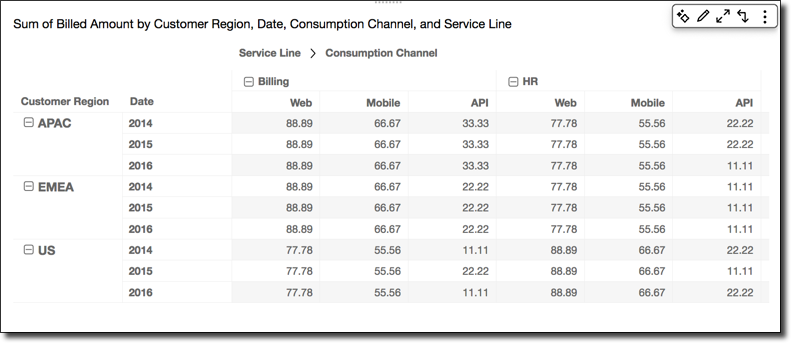
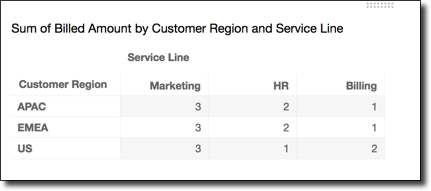
リストされている関数を次のデータに適用できます。
累積
[Running Total (累積)] 関数は、所定のセル値とそのセルの前のすべてのセルの値の合計を計算します。合計は、Cell1=Cell1, Cell2=Cell1+Cell2,
Cell3=Cell1+Cell2+Cell3 (以降同様) と計算されます。
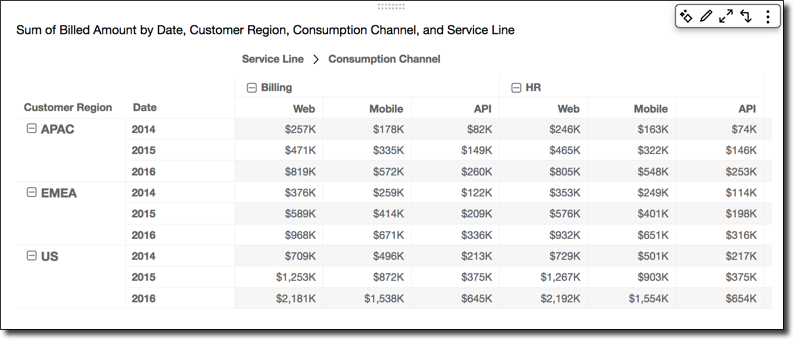
[Running total (累計)] 関数を、[Calculate as (として計算)] の Table across を使用してテーブルの行に適用すると、以下の結果が得られます。
Difference
[Difference (差異)] 関数は、あるセル値とそのセルの前のセルの値の相違を計算します。差異は、Cell1=Cell1-null, Cell2=Cell2-Cell1,
Cell3=Cell3-Cell2, (以降同様) と計算されます。Cell1-null =
null であるため、Cell1 の値は常に空白です。
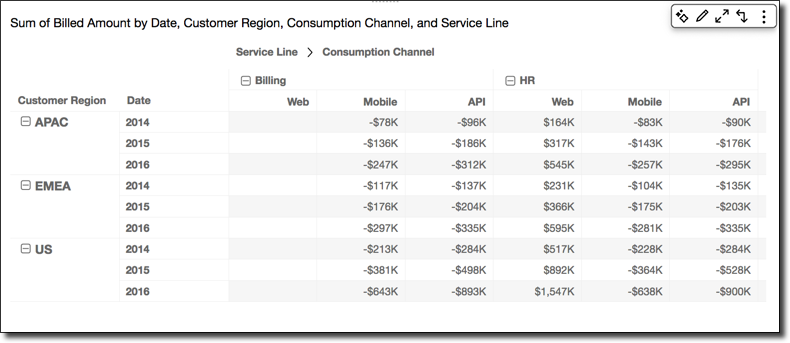
[Difference (差異)] 関数を、[Calculate as (として計算)] の Table across を使用してテーブルの行に適用すると、以下の結果が得られます。
パーセント差
[Percentage Difference (パーセント差)] 関数は、あるセル値とその前のセルの値のパーセント差を、前のセルの値で除算して計算します。この値は、Cell1=(Cell1-null)/null, Cell2=(Cell2-Cell1)/Cell1,
Cell3=(Cell3-Cell2)/Cell2, (以降同様) と計算されます。(Cell1-null)/null = null であるため、Cell1 の値は常に空白です。
[Percentage Difference (パーセント差)] 関数を、[Calculate as (として計算)] の Table across を使用してテーブルの行に適用すると、以下の結果が得られます。

全体比
[Percent of Total (全体比)] 関数は、計算に含まれるすべてのセルの合計に占める所定のセルの割合を計算します。割合は、Cell1=Cell1/(sum of all cells), Cell2=Cell2/(sum of all
cells), (以降同様) と計算されます。
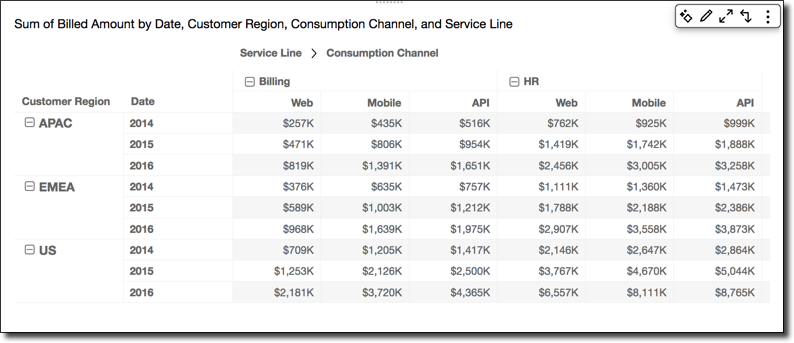
[Percent of Total (全体比)] 関数を、[Calculate as (として計算)] の Table across を使用してテーブルの行に適用すると、以下の結果が得られます。

ランク
[Rank (ランク)] 関数は、セルの値のランクを、計算に含まれるその他のセルの値と比較して計算します。ランクは常に最上位値が 1 と表示され、最下位値は計算に含まれるセルの数と等しくなります。等しい値を持つ 2 つ以上のセルがある場合、それらは同じランクを受け取りますが、ランク付けで自分のスポットを占めているとみなされます。したがって、次に高い値は、それより上のランクのセル数から 1 を引いた数だけランク内にプッシュダウンされます。例えば、値 5、3、3、4、3、2 をランク付けする場合、ランクは 1、3、3、2、3、6 です。
例えば、次のデータがあるとします。
[Rank (ランク)] 関数を、[Calculate as (として計算)] の Table across を使用してテーブルの行に適用すると、以下の結果が得られます。
パーセンタイル
[Percentile (パーセンタイル)] 関数は、該当セルの値以下の、計算に含まれているセルの値のパーセントを計算します。
このパーセントは以下のように計算されます。
percentile rank(x) = 100 * B / N

Where:
   B = number of scores below x
N = number of scores[Percentile (パーセンタイル)] 関数を、[Calculate as (として計算)] の Table across を使用してテーブルの行に適用すると、以下の結果が得られます。